

Immunogenic cell death mediation patterns reveal novel paradigm for characterizing the immune microenvironment and immunotherapeutic responses in bladder cancer
- PMID: 36386817
- PMCID: PMC9640952
- DOI: 10.3389/fgene.2022.1035484
Immunogenic cell death mediation patterns reveal novel paradigm for characterizing the immune microenvironment and immunotherapeutic responses in bladder cancer
Abstract
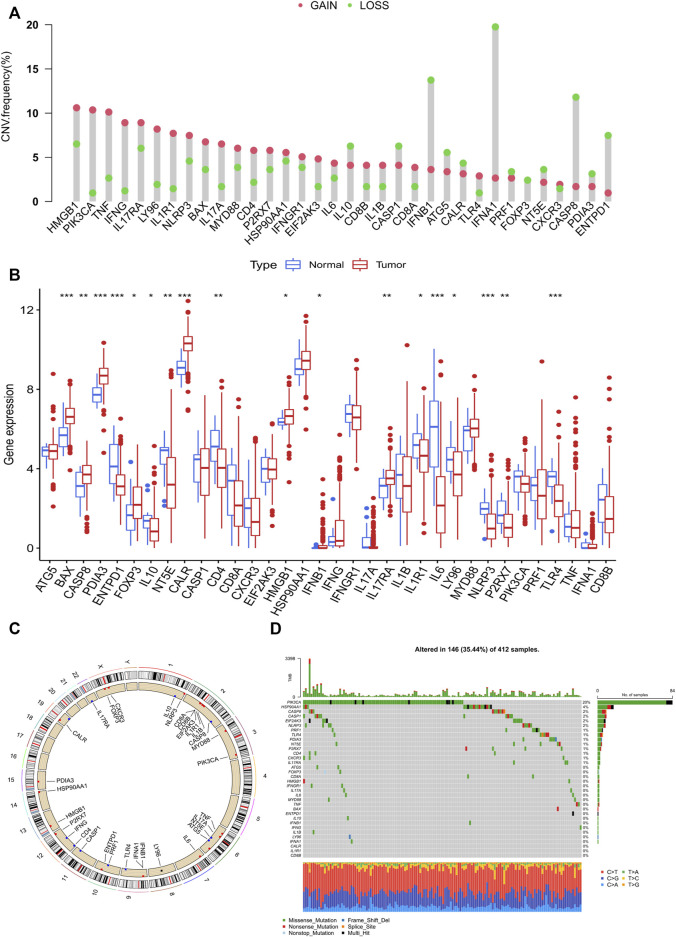
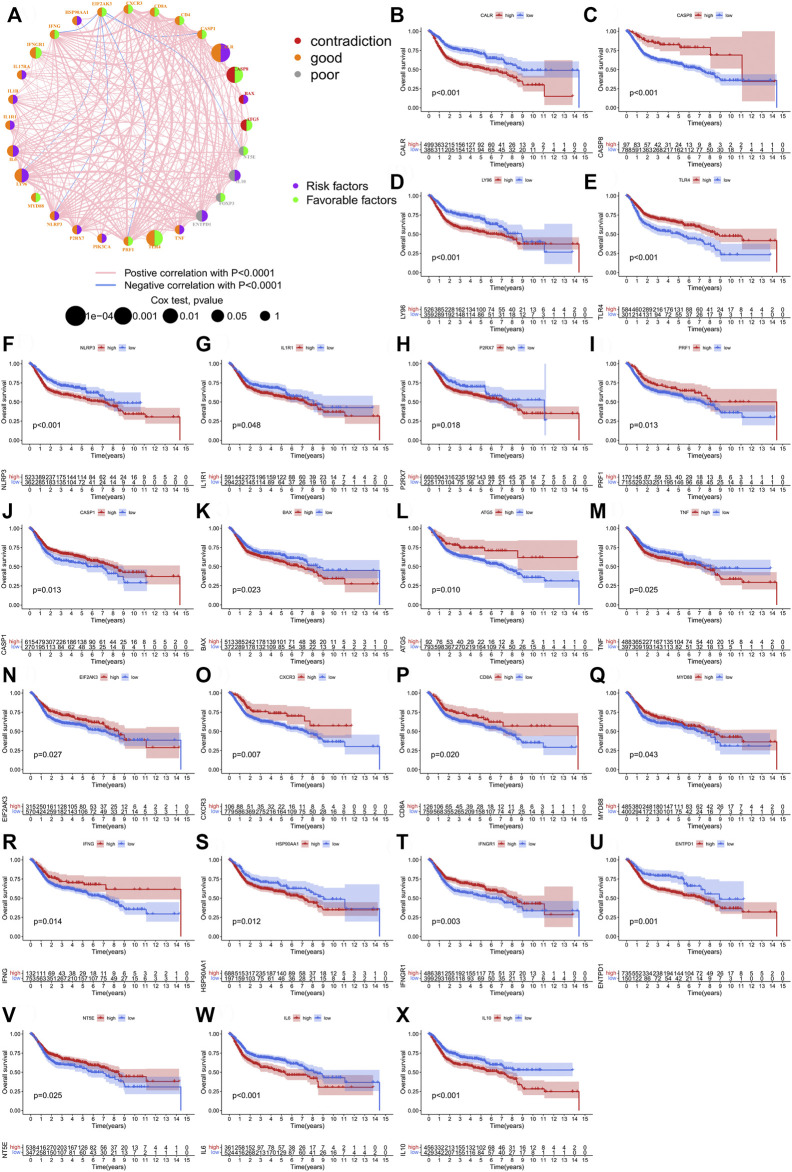
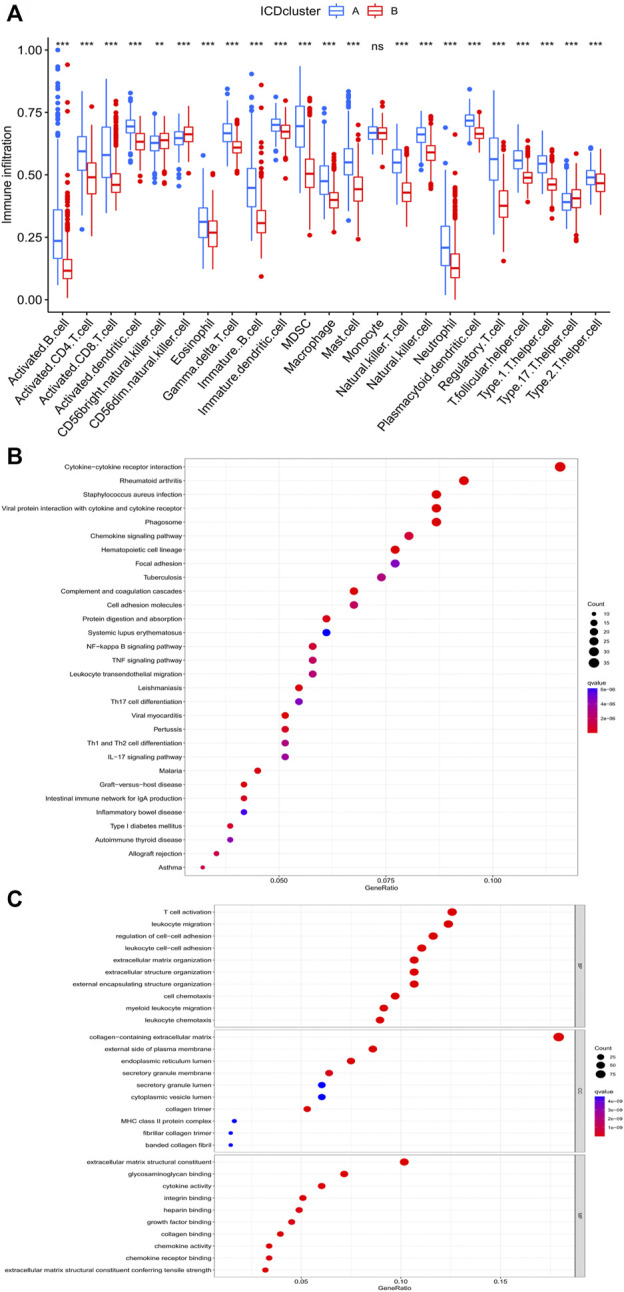
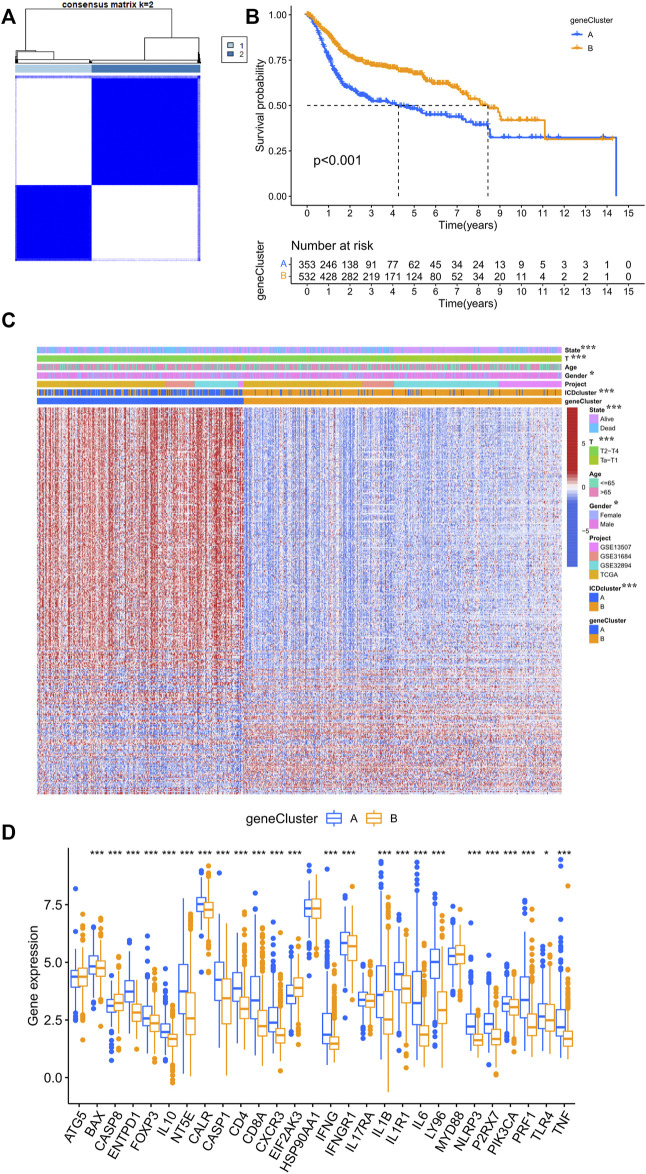
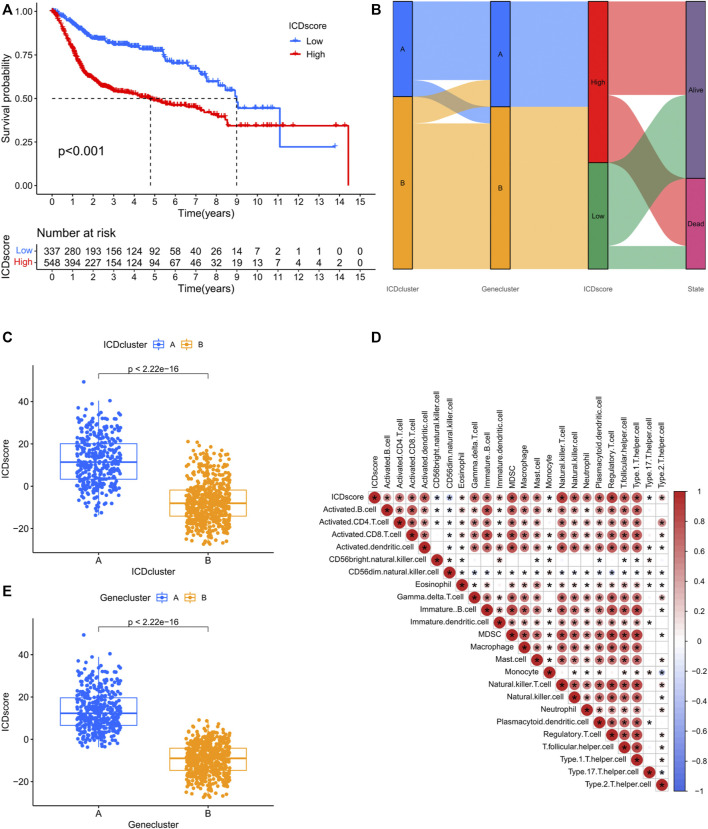
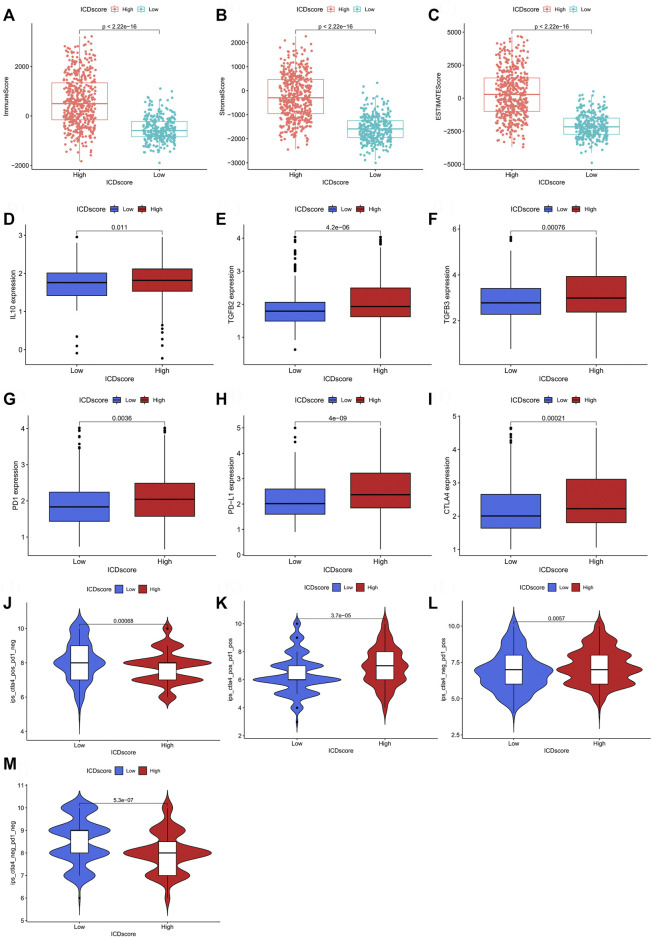
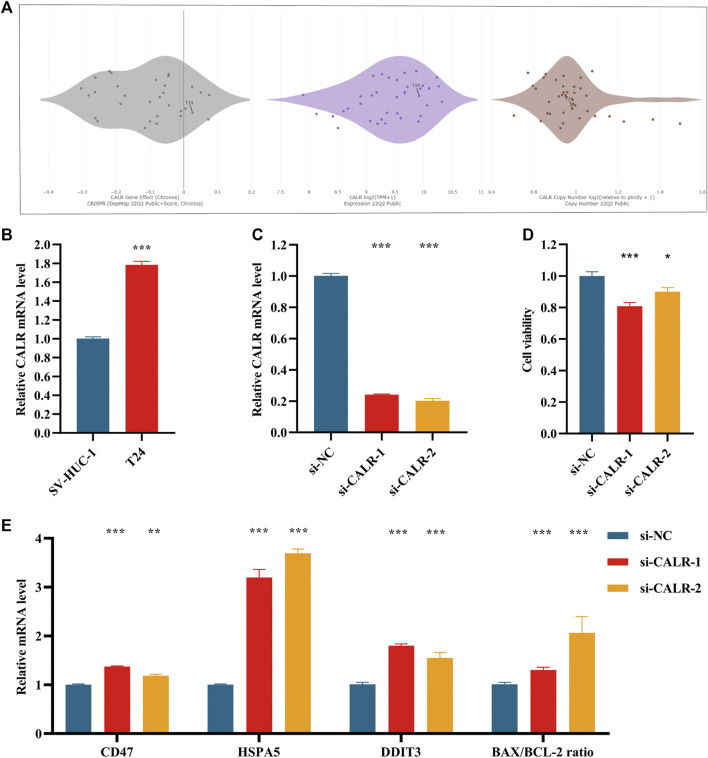
Background: Immunogenic cell death (ICD) plays an important role in several malignancies. However, the role of ICD-mediated patterns in bladder cancer (BCA) remains unknown. Methods: For assessing the ICD-mediated patterns based on the expression of IRGs, 4 large BCA cohorts were obtained. The ICD-mediated patterns of individual samples were quantified as an ICD score by principal component analysis. The correlations of the ICD-mediated patterns with the tumor immune microenvironment (TIME) and responses to immunotherapy were comprehensively evaluated. The IRGs with predictive prognostic values were further validated by in vitro loss of function assays. Results: Two distinct ICD-mediated patterns were established, showing distinct clinical features and immune microenvironment features. Although ICD cluster A was associated with a poor prognosis with a high ICD score, it showed an immune activation state with a more favorable response to immunotherapy and treatment that induced ICD. The ICD-related gene, CALR, was significantly upregulated in the T24 BCA cell line relative to the control SV-HUC-1 cells. Knocking down CALR suppressed T24 cell viability and caused ER stress. Conclusion: We identified the existence of distinct ICD-mediated patterns in BCA closely associated with the remodeling of the TIME. Further in-depth examination of ICD-related features is warranted to obtain a broader prospect for therapeutic innovations and improved prognosis of BCA.
Keywords: bladder cancer; immune checkpoint inhibitors; immunogenic cell death; immunotherapy; tumor immune microenvironment.
Copyright © 2022 Fu, Zhang and Jiang.
Conflict of interest statement
The authors declare that the research was conducted in the absence of any commercial or financial relationships that could be construed as a potential conflict of interest.
Figures
Similar articles
-
A comprehensive analysis of immunogenic cell death and its key gene HSP90AA1 in bladder cancer.Clin Transl Oncol. 2023 Aug;25(8):2587-2606. doi: 10.1007/s12094-023-03143-3. Epub 2023 Mar 31. Clin Transl Oncol. 2023. PMID: 37000291
-
Identification of immunogenic cell death-associated subtypes and characterization of the tumor microenvironment in endometrial cancer.J Gene Med. 2023 Jul;25(7):e3495. doi: 10.1002/jgm.3495. Epub 2023 Apr 11. J Gene Med. 2023. PMID: 36894497
-
Classification related to immunogenic cell death predicts prognosis, immune microenvironment characteristics, and response to immunotherapy in lower-grade gliomas.Front Immunol. 2023 Apr 19;14:1102094. doi: 10.3389/fimmu.2023.1102094. eCollection 2023. Front Immunol. 2023. PMID: 37153540 Free PMC article.
-
Restoring the Immunity in the Tumor Microenvironment: Insights into Immunogenic Cell Death in Onco-Therapies.Cancers (Basel). 2021 Jun 5;13(11):2821. doi: 10.3390/cancers13112821. Cancers (Basel). 2021. PMID: 34198850 Free PMC article. Review.
-
Combination Cancer Immunotherapy of Nanoparticle-Based Immunogenic Cell Death Inducers and Immune Checkpoint Inhibitors.Int J Nanomedicine. 2021 Feb 22;16:1435-1456. doi: 10.2147/IJN.S285999. eCollection 2021. Int J Nanomedicine. 2021. PMID: 33654395 Free PMC article. Review.
Cited by
-
Prognostic Significance and Immune Landscape of an Efferocytosis-Related Gene Signature in Bladder Cancer.Biochem Genet. 2024 Sep 23. doi: 10.1007/s10528-024-10924-0. Online ahead of print. Biochem Genet. 2024. PMID: 39313721
-
Clinical application of immunogenic cell death inducers in cancer immunotherapy: turning cold tumors hot.Front Cell Dev Biol. 2024 May 7;12:1363121. doi: 10.3389/fcell.2024.1363121. eCollection 2024. Front Cell Dev Biol. 2024. PMID: 38774648 Free PMC article. Review.
-
Trial watch: chemotherapy-induced immunogenic cell death in oncology.Oncoimmunology. 2023 Jun 3;12(1):2219591. doi: 10.1080/2162402X.2023.2219591. eCollection 2023. Oncoimmunology. 2023. PMID: 37284695 Free PMC article. Review.
-
Targeted therapies in bladder cancer: signaling pathways, applications, and challenges.MedComm (2020). 2023 Dec 15;4(6):e455. doi: 10.1002/mco2.455. eCollection 2023 Dec. MedComm (2020). 2023. PMID: 38107059 Free PMC article. Review.
References
LinkOut - more resources
Full Text Sources
Research Materials
Miscellaneous