. 2022 Jun;2(6):503-517.
doi: 10.1158/2767-9764.crc-22-0168. Epub 2022 Jun 24.

Replication stress defines distinct molecular subtypes across cancers

Affiliations

Replication stress defines distinct molecular subtypes across cancers

Nobuyuki Takahashi et al. Cancer Res Commun. 2022 Jun.

Abstract

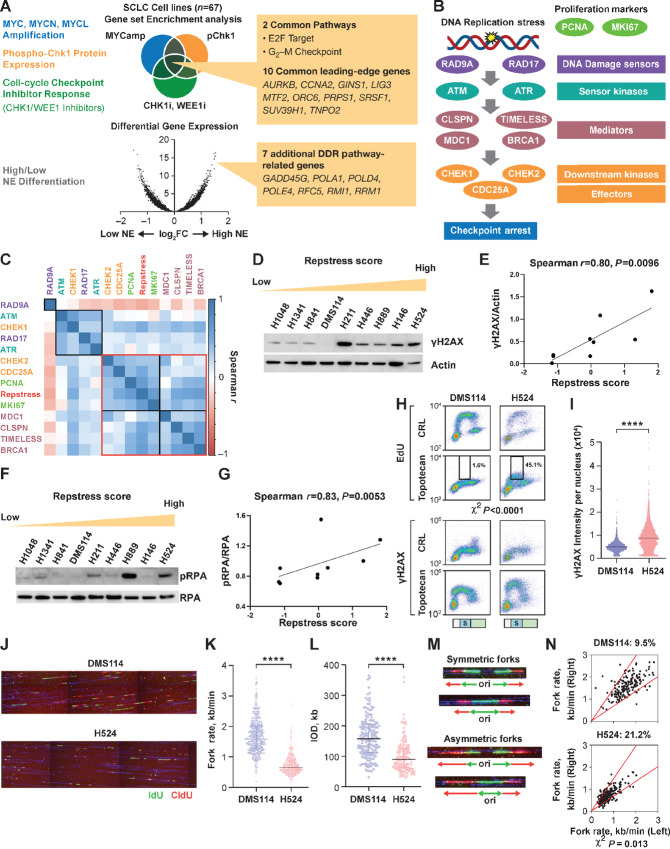
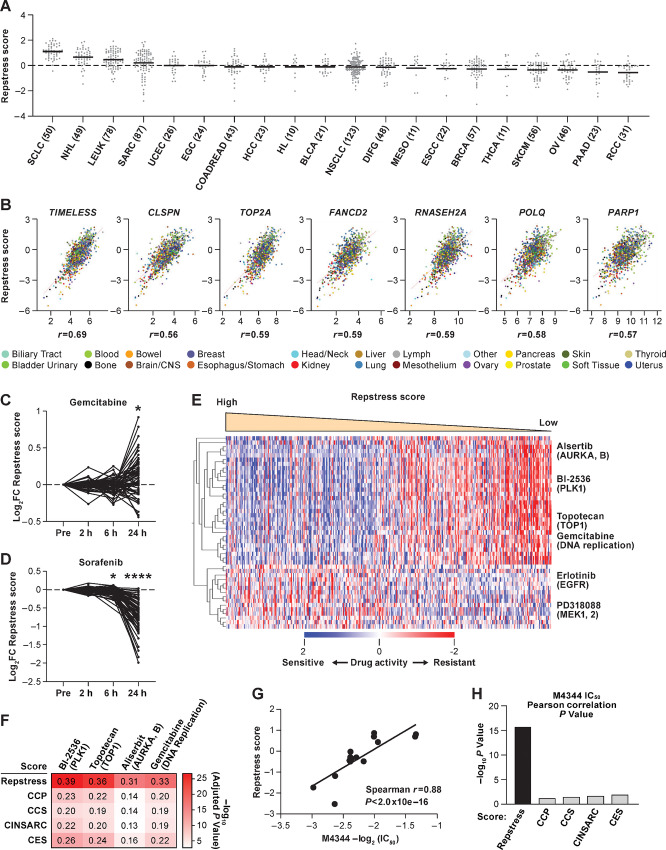
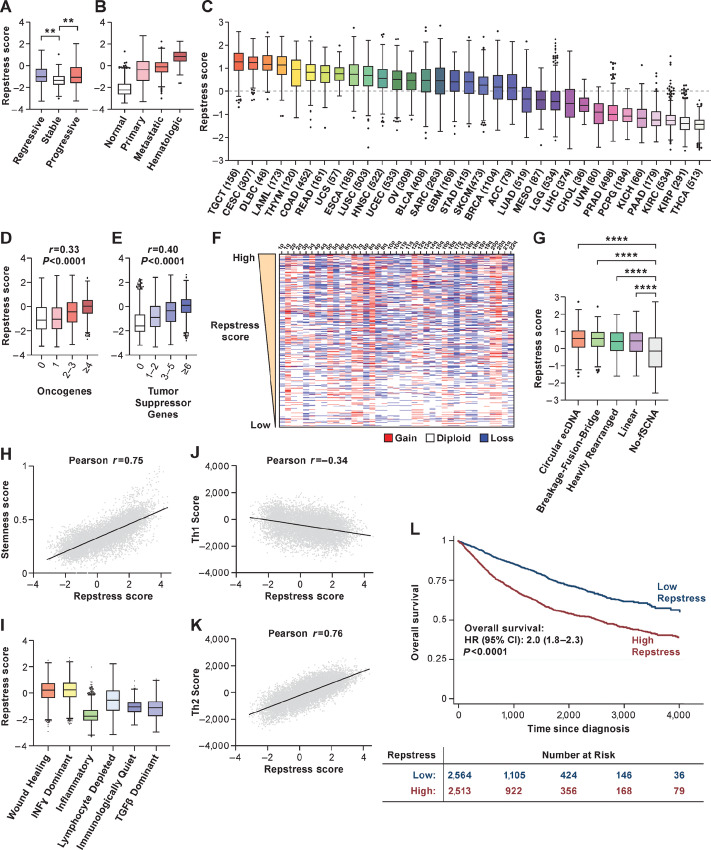
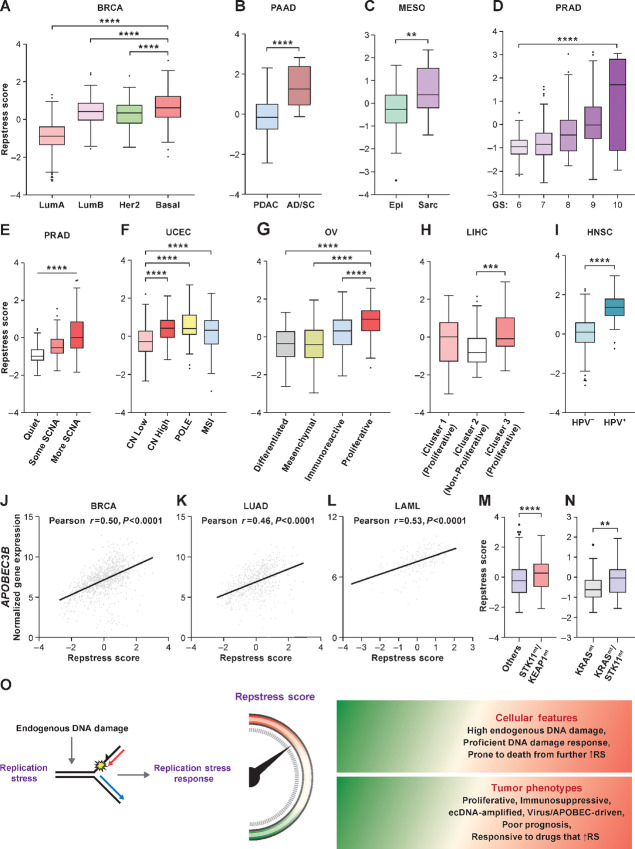
Endogenous replication stress is a major driver of genomic instability. Current assessments of replication stress are low throughput precluding its comprehensive assessment across tumors. Here we develop and validate a transcriptional profile of replication stress by leveraging established cellular characteristics that portend replication stress. The repstress gene signature defines a subset of tumors across lineages characterized by activated oncogenes, aneuploidy, extrachromosomal DNA amplification, immune evasion, high genomic instability, and poor survival, and importantly predicts response to agents targeting replication stress more robustly than previously reported transcriptomic measures of replication stress. Repstress score profiles the dual roles of replication stress during tumorigenesis and in established cancers and defines distinct molecular subtypes within cancers that may be more vulnerable to drugs targeting this dependency. Altogether, our study provides a molecular profile of replication stress, providing novel biological insights of the replication stress phenotype, with clinical implications.


Conflict of interest statement

Conflict of interest disclosure statement: The authors have declared that no conflict of interest exists.

Figures

FIGURE 1
FIGURE 1
Generation and in vitro functional validation of a repstress gene signature in SCLC cell lines. A, Schematic representation of the repstress gene signature derivation, which is based on four key characteristics associated with replication stress: (i) amplification of MYC paralogs; (ii) expression of p-Chk1; (iii) sensitivity with CHK1 and WEE1 inhibitors; and (iv) NE. B, Schematic representation highlighting key components of the replication stress response pathway The DNA damage sensors recruit kinases ATM and ATR that in turn phosphorylate mediators such as MDC1 and BRCA1 which sustain the DDR signaling. DDR signaling then engages downstream kinases CHK1 and CHK2 and eventually activates downstream effectors such as CDC25A phosphatases triggering transient cell-cycle arrest. C, Pairwise correlations between expression of DDR genes, proliferation markers PCNA and MKI67, and repstress score in 67 SCLC cell lines. Colors of gene name labels denote replication stress response functions indicated in B. Genes are clustered by Euclidean distance, using the complete-linkage clustering method, indicated with squares with black and red lines. Western blot analysis (D) and correlations (E) of γH2AX signal with repstress score in SCLC cell lines. SCLC cell lines are ordered from low to high repstress score (range: −1.2 to 1.8) from left to right in D. Western blot analysis (F) and correlations (G) of pRPA signal with repstress score in SCLC cell lines. SCLC cell lines are ordered from low to high repstress score (range: −1.2 to 1.8) from left to right in F. H and I, S-phase arrest and induction of γH2AX by exogenous replication stress by topotecan treatment in S-phase SCLC cell lines. EdU incorporation (top) and γH2AX induction (bottom) in SCLC cell lines with low (DMS114) and high repstress score (H524) are shown in H. Cell-cycle effects are defined by propidium iodide staining (Supplementary Fig. S5) and G1, S, G2–M phases are indicated on the bottom of the panels with light green, light blue with the letter of S, and light orange bars, respectively. Black squares indicate proportion of EdU incorporating S-phase cells, gated by cutoff of EdU signal intensity >1.0 × 10³. A comparison of quantified γH2AX signal intensity per nucleus with topotecan treatment in S-phase cells is shown in I. ****, P < 0.0001 by unpaired Student t test. J–L, DNA combing analysis of SCLC cell lines with low (DMS114) and high (H524) repstress scores. Representative images (J) and quantifications of replication fork speed (K) and interorigin distance (L) are shown. Green and red lines in J indicate IdU and CIdU, respectively. ****, P < 0.0001 by Mann–Whitney U test. Representative images (M) and quantification (N) of fork asymmetry in DNA combing analysis of SCLC cell lines with low (DMS114) and high (H524) repstress score Fork asymmetry was defined by >30% difference of fork speed between one direction with the other as described previously (25), indicating with a redline in N. The proportions of DNAs with fork asymmetry in each cell line were indicated on top of N. MYCamp, MYC amplification; WEEi1, WEE1 inhibitor; CHK1i, CHK1 inhibitor; p-Chk1, phosphorylated Chk1; Cont, control; PI, propidium iodide; CIdU, chlorodeoxyuridine; kb, kilobase; IOD, interorigin distance; ori, origin.
FIGURE 2
FIGURE 2
Across cancer cell lines, repstress score profiles replication stress at a functional network level. A, Dot plot showing distribution of repstress score across 839 cancer cell lines from 20 cancer types represented in the CCLE. A black bar in each cancer type indicates the mean repstress score within each cancer type. Dashed line indicates zero of Z-normalized repstress score across all of cancer cell lines in CCLE. The numbers with cancer type labels on x-axis indicate the numbers of cell lines included. B, Across cancers, repstress score correlates with expression of representative genes involved in: (i) increasing replication stress tolerance by protecting replication forks (TIMELESS, CLSPN), (ii) solving topological problems during replication (TOP2A), (iii) facilitating the repair and restart of stalled replication forks (FANCD2), (iv) resolving barriers to replication fork progression (RNASEH2A), and (v) DNA damage repair factors (POLQ and PARP1). Correlations were analyzed in CellMiner CDB (16). Spearman correlation coefficients (r) are indicated. All of P values by Spearman correlation test are <0.0001. Dynamics of normalized repstress score with treatment of gemcitabine (C) and sorafenib (D) in NCI60 cell lines. Dynamics of gene expression pretreatment and posttreatment are retrieved from The NCI Transcriptional Pharmacodynamics Workbench (42). *, P < 0.05; ****, P < 0.0001 by Wilcoxon signed-rank test. For detailed method, please refer the Supplementary Materials and Methods. E, Heatmap of sensitive or resistant agents in cell lines with high versus low repstress score in the CTRP. Drug activity scores indicate calculated AUC over a 16-point concentration range using an automated, high-throughput workflow fitting concentration–response curves (43). The drug activity scores were retrieved from CellMiner CDB (16) and z score normalized in the heatmap. Cell lines are sorted by repstress score from high (left) to low (right). The heatmap shows 30 mostly sensitive compounds in high repstress score cell lines, and all of sensitive compounds in low repstress score cell lines with FDR of <5%. For detailed methods, please refer Supplementary Materials and Methods. F, Heatmap of Pearson correlations between gene signature scores and activities of drugs targeting replication stress. The color in each column indicates log-transformed P value of Pearson correlation between annotated gene signature score and drug activity score. The number in each column shows Pearson correlation coefficient between them. CCP, CCS, CINSARC, and CES scores are calculated as reported previously (39, 45–47). G, Correlations between half maximal inhibitory concentration (IC50) values of M4344 (an ATR-related inhibitor) and repstress score in different cancer type cell lines. The IC50 value of M4344 in different cancer type cell lines was examined in a previous report (48). H, Comparison of Spearman correlations between M4344 IC50 values and scores of repstress and other cell proliferation gene signatures. Each bar represents log-transformed P value of Spearman correlation between annotated gene signature and M4344 IC50 values. The IC50 value of M4344 in different cancer type cell lines is examined in a previous report (48). CCP, CCS, CINSARC, and CES scores are calculated as reported previously (39, 45–47). NHL, non–Hodgkin lymphoma; LEUK, leukemia; SARC, sarcoma; UCEC, uterine endometrioid cancer; EGC, esophagogastric adenocarcinoma; COADREAD, colorectal adenocarcinoma; HCC, hepatocellular carcinoma; HL, Hodgkin lymphoma; BLCA, bladder urothelial carcinoma; NSCLC, non–small cell lung cancer; DIFG, diffuse glioma; MESO, mesothelioma; ESCC, esophageal squamous cell carcinoma; BRCA, breast carcinoma; THCA, thyroid cancer; SKCM, skin melanoma; OV, ovarian cancer; PAAD, pancreatic adenocarcinoma; RCC, renal cell carcinoma; FC, fold change; hr, hour; AURKA, B, aurora kinase A and B; PLK1, polo-like kinase-1; TOP1, topoisomerase I; MAPK1, 2, mitogen-activated protein kinase kinase 1 and 2;CCP, cell-cycle progression; CCS, cell-cycle score; CINSARC, complexity index in sarcomas; CES, Centromere and kinetochore gene expression score.
FIGURE 3
FIGURE 3
Across cancer types, repstress score defines cancers characterized by genomic instability, immune evasion, and poor prognosis. A, Comparison of repstress score among bronchial premalignant lesions which regressed to normal tissue (regressive), did not change the premalignant histology (stable), and progressed to invasive malignancy (progressive) after biopsy. Gene expression data are obtained from a previous report (50). **, P < 0.01 by one-way ANOVA followed by Tukey multiple comparison test. B, Comparison of repstress score among TCGA normal tissue, primary and metastatic epithelial cancers, and hematopoietic malignancies P < 0.0001 by comparing repstress scores in normal tissues versus primary and metastatic epithelial cancers, and hematologic malignancies; and comparing those in hematologic malignancies versus primary cancer and metastatic cancers; whereas P > 0.05 comparing those in primary and metastatic epithelial cancers. P values are analyzed by one-way ANOVA followed by Tukey multiple comparison test. C, Distribution of repstress scores across 33 cancer types in TCGA The number in the x-axis label indicates the number of tumors included in each cancer type. A dash line indicates zero of Z-normalized repstress score across all of tumors in TCGA. Pan-cancer analysis showing the relationship between repstress score with the number of mutated oncogenes (D) and tumor suppressor genes (E; ref. 54). Spearman correlation coefficient (r) and P values are indicated on top of each panel. Hypermutated tumors (i.e., mutational burden of ≥ 50 mutations per megabase) are excluded. F, Copy-number alteration heatmap sorted by high (top) to low (bottom) repstress score. Chromosome with copy-number deletion or gain are indicated with blue and red, respectively. Copy-number alteration data in TCGA tumors are retrieved from a previous report (81). G, Comparison of repstress scores among tumors with amplicons of circular ecDNA, breakage-fusion-bridge, heavily rearranged, linear, and no focal somatic copy-number amplification Annotations of amplification for each tumor in TCGA are reported previously (55). ****, P < 0.0001 by one-way ANOVA followed by Tukey multiple comparison test. H, Correlation between cancer stemness score and repstress score. Cancer stemness score is derived by integrative transcriptome- and methylation-based analysis (57). The P value of Pearson correlation is <0.0001. I, Comparison of repstress score across six distinct TCGA immune subtypes, derived by gene signature–based clustering approach. Immune subtypes are described previously (58). P < 0.0001 by comparing repstress score in wound healing group versus the others; IFNγ dominant group versus the others; and inflammatory versus the others, respectively. P values are analyzed by one-way ANOVA followed by Tukey multiple comparison test. Correlations between Th1 (J) and Th2 (K) scores, and repstress score across cancer types Th1 and Th2 scores are available in a previous report (58). The P values of Pearson correlation are <0.0001 in J and K. L, OS in patients with cancer with high versus low repstress score. High versus low repstress scores are defined as patients whose cancers have repstress score ≥75th or <25th percentiles across TCGA tumors. P value is derived from the log-rank test. TCGA: The Cancer Genome Atlas; fSCNA: focal somatic copy-number alteration; CI, confidence interval. Abbreviations for cancer types in TCGA are available from https://gdc.cancer.gov/resources-tcga-users/tcga-code-tables/tcga-study-abbreviations.
FIGURE 4
FIGURE 4
Resptress score identifies distinct molecular subtypes among various cancer types. A, Repstress scores among different breast cancer molecular subtypes. ****, P < 0.0001 by one-way ANOVA followed by Tukey multiple comparison test. B, Repstress scores in pancreatic cancers with adenocarcinoma (PDAC) versus adenosquamous (AD/SC) histology. ****, P < 0.0001 by Mann–Whitney U test. C, Repstress scores in malignant mesothelioma with epithelioid (Epi) versus sarcomatoid or mixed epithelioid and sarcomatoid (Sarc) histology. **, P < 0.01 by Mann–Whitney U test. D, Repstress scores among prostate cancers with different Gleason scores. ****, P < 0.0001 by linear trend test from left to right. E, Repstress scores and somatic copy-number alterations (SCNA) of TCGA prostate cancers SCNA subtype are defined by copy number–based clustering in a previous report (64). ****, P < 0.0001 by linear trend test from left to right. F, Repstress scores among uterine corpus endometrial carcinomas with different SCNA subtypes. SCNA subtypes are defined by copy number–based clustering in a previous report (65). ****, P < 0.0001 by one-way ANOVA followed by Tukey multiple comparison test. G, Repstress scores among transcriptomic subtypes in ovarian carcinoma The molecular subtypes are defined on the basis of transcriptome-based clustering in a previous report (66). ****, P < 0.0001 by one-way ANOVA followed by Tukey multiple comparison test. H, Repstress scores among genomic subtypes in hepatocellular carcinoma. The molecular subtypes (iCluster) are defined on the basis of an integrative analysis of DNA copy number, DNA methylation, mRNA expression, miRNA expression, and RPPA in a previous report (67). ***, P < 0.001 by one-way ANOVA followed by Tukey multiple comparison test. I, Repstress scores between patients with HPV-null (HPV−) and HPV-driven (HPV+) head and neck cancers. ****, P < 0.0001 by unpaired Student t test. Correlations between gene expression of APOBEC3B and repstress score in breast cancer (J), lung adenocarcinoma (K), and acute myeloid leukemia (L). Repstress score comparison between tumors with KEAP1/STK11 coalterations compared with those without (M), and tumors with KRAS/STK11 coalterations compared with KRAS single-altered tumors (N) in lung adenocarcinoma. Gene alterations or copy-number deletion (either heterozygous or homozygous) are considered as genetically alteration in KRAS, KEAP1, and STK11. Lung adenocarcinoma with KRAS/TP53 or KRAS/CDKN2A comutations are excluded from the analysis in N given a previous study reporting that non–small cell lung cancer with these comutations is different subtype from KRAS/STK11 comutated subtype (71, 72). ****, P < 0.0001; **, P < 0.01 by Mann–Whitney U test. O, A schema of repstress gene signature characterizing replication stress and its response. TCGA, The Cancer Genomic Atlas; LumA, luminal A; LumB, luminal B; PDAC, pancreatic adenocarcinoma; AD/SC, adenosquamous; Epi, epithelioid; Sarc, sarcomatoid; GS, Gleason score; SCNA, somatic copy-number alteration; CN, copy number; POLE, DNA polymerase epsilon, catalytic subunit; MSI, microsatellite instable; HPV, human papillomavirus; APOBEC, apolipoprotein B mRNA editing enzyme, catalytic polypeptide-like; STK11, Serine/threonine kinase 11; KEAP1, Kelch-like ECH-associated protein 1; RS, replication stress. Abbreviations for cancer types in TCGA are available from https://gdc.cancer.gov/resources-tcga-users/tcga-code-tables/tcga-study-abbreviations.

Similar articles

Cited by

References

    1. Hanahan D, Weinberg RA. Hallmarks of cancer: the next generation. Cell 2011;144:646–74. - PubMed
    1. Zeman MK, Cimprich KA. Causes and consequences of replication stress. Nat Cell Biol 2014;16:2–9. - PMC - PubMed
    1. Osborn AJ, Elledge SJ, Zou L. Checking on the fork: the DNA-replication stress-response pathway. Trends Cell Biol 2002;12:509–16. - PubMed
    1. Ciccia A, Elledge SJ. The DNA damage response: making it safe to play with knives. Mol Cell 2010;40:179–204. - PMC - PubMed
    1. Toledo LI, Altmeyer M, Rask MB, Lukas C, Larsen DH, Povlsen LK, et al. . ATR prohibits replication catastrophe by preventing global exhaustion of RPA. Cell 2013;155:1088–103. - PubMed

Publication types