. 2022 Nov 23;185(24):4560-4573.e19.
doi: 10.1016/j.cell.2022.10.018. Epub 2022 Nov 10.

Membrane phosphoinositides regulate GPCR-β-arrestin complex assembly and dynamics

Affiliations

Membrane phosphoinositides regulate GPCR-β-arrestin complex assembly and dynamics

John Janetzko et al. Cell. .

Abstract

Binding of arrestin to phosphorylated G protein-coupled receptors (GPCRs) is crucial for modulating signaling. Once internalized, some GPCRs remain complexed with β-arrestins, while others interact only transiently; this difference affects GPCR signaling and recycling. Cell-based and in vitro biophysical assays reveal the role of membrane phosphoinositides (PIPs) in β-arrestin recruitment and GPCR-β-arrestin complex dynamics. We find that GPCRs broadly stratify into two groups, one that requires PIP binding for β-arrestin recruitment and one that does not. Plasma membrane PIPs potentiate an active conformation of β-arrestin and stabilize GPCR-β-arrestin complexes by promoting a fully engaged state of the complex. As allosteric modulators of GPCR-β-arrestin complex dynamics, membrane PIPs allow for additional conformational diversity beyond that imposed by GPCR phosphorylation alone. For GPCRs that require membrane PIP binding for β-arrestin recruitment, this provides a mechanism for β-arrestin release upon translocation of the GPCR to endosomes, allowing for its rapid recycling.

Keywords: GPCR; arrestin; conformational dynamics; endocytosis; fluorescence spectroscopy; phosphoinositides; signaling.


Conflict of interest statement

Declaration of interests B.K.K. is a cofounder and consultant for ConfometRx, Inc.

Figures

Figure 1.
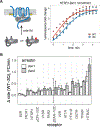
Figure 1.. βarr PIP binding is important for recruitment to and desensitization of GPCRs
(A) Cartoon depicting GPCR signaling and desensitization. In key, “phosphate” denotes phosphorylated Ser/Thr residues. (B) cAMP response in Δβarr1/2 HEK293 cells upon stimulation of endogenous β2AR with isoproterenol (iso). Data are normalized to response with Forskolin (Fsk) plus 3-isobutyl-1-methylxanthine (IBMX) and shown as mean ± SEM (n = 6; hereafter n denotes numbers of independent experiments). (C) Desensitization (percentage reduction relative to mApple) measured as area under curve shown in (B). Conditions were compared by one-way analysis of variance (ANOVA) with Tukey’s multiple comparison test. ****p < 0.0001; ns, p > 0.05. (D) NanoBiT assay measuring βarr translocation to PM upon stimulation with GPCR agonist. Complementation of SmBiT and LgBiT forms a functional luciferase (see key in A). (E) Two representative GPCRs illustrate data obtained for βarr recruitment in the NanoBiT assay. Luminescence was measured over time after agonist addition (at t = 0 min), and values are shown as fold change (FC) over vehicle treatment ± SD (n = 3–4 performed in technical duplicate). Colors denote concentration of agonist (iso for β1AR and neurotensin for NTSR1) used for stimulation. Gray boxes show the integration range for endpoint values used for CRCs. (F) CRCs obtained from data shown in (E). (G) LOF values obtained for 23 GPCRs. Points are LOF and error bars are standard error in LOF. Dashed ellipses denote clusters obtained from k means clustering of data. Vertical gray lines denote LOF = 0 and LOF = 1; vertical purple and orange lines are the centers of the respective clusters and correspond to LOF = 0.06 and LOF = 0.73, respectively.
Figure 2.
Figure 2.. Loss of βarr PIP binding slows βarr recruitment to strongly coupled GPCRs
(A) Left, cartoon depicting βarr translocation kinetics. Right, representative fits of initial rates for translocation of βarr1 (WT or 3Q) to PM upon stimulation of NTSR1. (B) Difference in initial rate between WT and 3Q βarr1/2. Data are mean ± SEM (n = 3).
Figure 3.
Figure 3.. NTSR1 phosphorylation patterns govern PIP dependence for βarr recruitment
(A) Left, cartoon of human NTSR1 showing motifs in ICL3 and C terminus that are subject to phosphorylation. Phosphorylation sites examined in this study are in red (numbered 1–10). Residue numbers corresponding to the region of human NTSR1 are listed at the start and end of sequences. Construct key shows possible phosphosites as empty boxes, which when mutated to alanine are denoted by “X.” Right, LOF for recruitment of βarr1 to different NTSR1 constructs, measuring by PM bystander NanoBiT assay. Data are mean ± SEM (n = 3). Vertical gray lines denote LOF = 0 and LOF = 1; vertical purple and orange lines are the centers of clusters 1 and 2 (LOF = 0.06 and LOF = 0.73, respectively) as shown in Figure 1G. (B) Translocation of βarr1 to endosomes upon agonist stimulation as measured by the endosomal bystander NanoBiT assay (Figure S1I). Data indicate recruitment (fold change over basal upon stimulation) for WT and 3Q βarr1, shown as circles and triangles, respectively. Shapes and error bars are mean and SEM, respectively, from n = 3. Points are colored by cluster designation obtained from k means clustering of all GPCR-βarr recruitment data. (C) Flow-cytometry-based GPCR internalization assay. Δβarr1/2 cells expressing N-terminally FLAG-tagged NTSR1 or β2AR constructs along with βarr constructs indicated were stimulated with agonist (neurotensin or iso, respectively). Data show loss of cell-surface receptors (n = 5–10). Internalization by 3Q βarr1 and mock were each compared with WT using a two-tailed paired t test. ns, p > 0.05; *p % 0.05, **p % 0.01, ***p % 0.001, and ****p % 0.0001.
Figure 4.
Figure 4.. PIP binding stabilizes fully engaged GPCR-βarr complexes
(A) Cartoon of complexing efficiency assay. SEC resolves complex from components. (B) Representative experiment showing SEC chromatograms with vertical dashed lines indicating free NTSR1, complex, and free βarr1. (C) Complexing efficiency for NTSR1 with the indicated βarr constructs. Individual points are shown (n = 6). Two-tailed unpaired t test used to compare conditions. ns, p > 0.05; ****p % 0.0001. (D) Cartoon showing equilibrium of NTSR1-βarr1complex. Pink star denotes bimane probe used for experiment shown in (E). (E) Spectra of L68bim-labeled βarr1 in complex with NTSR1. Individual points are shown (n = 3). V2Rpp-NTSR1 (GRK5p) and V2Rpp-NTSR1 (unphos) + V2Rpp were each compared by two-tailed unpaired t test. ns, p > 0.05; *p % 0.05. “Apo” indicates free βarr1; “unphos” and “GRK5p” indicate unphosphorylated and GRK5-phosphorylated NTSR1, respectively. Spectra are normalized to apo (100%) for each experiment, and the fluorescence intensity at λmax was compared. (F) Free energy diagram illustrating how PIP binding, by stabilizing the fully engaged state of the NTSR1-βarr1 complex, slows βarr1 dissociation.
Figure 5.
Figure 5.. PIP2 alone promotes conformational changes in βarr1
(A) Overlay of inactive (PDB: 1G4M) and active (PDB: 4JQI) βarr1. The N and C lobes of βarr1 are indicated. Activation leads to reorganization of several loops; the gate and finger loops are highlighted. Re-orientation of these loops from inactive (yellow) to active (green) is monitored by site-specific fluorescence spectroscopy. In finger loop inset, the sphere denotes Cα L68C, which is labeled with bim. In gate loop inset, the sphere denotes Cα L293C, which is labeled with NBD. The installed W residue replacing L167 that quenches 293NBD is shown. (B) Spectra of L68bim-labeled βarr1 in response to V2Rpp and PIP2. (C) Spectra of L167W-L293NBD-labeled βarr1 in response to V2Rpp and PIP2. (D) Left, cartoon showing how FRET change is linked to C-terminal release. Right, spectra of AF488/AT647N-labeled βarr1 in response to V2Rpp and PIP2. In (B)–(D), arrows indicate direction of change with increasing concentration. In (B) and (C), values are mean ± SEM (n = 3), and spectra were normalized to apo for each experiment. In (D), spectra are normalized by donor intensity within a given experiment, and data are shown for a representative experiment (n = 2–4).
Figure 6.
Figure 6.. PIP2 enhances Fab30 binding to βarr1
(A) Cartoon of SPR experiments, where βarr1 is immobilized via N-terminal biotinylation, and Fab30 is injected in the presence or absence of PIP2 or V2Rpp. (B) Representative sensograms for SPR experiment with WT βarr1 immobilized. (C) Binding of Fab30 (1 μM) to immobilized βarr1 constructs in the presence of different additives. Percentage of maximal binding is based on expected maximum response for 1:1 interaction with Fab30. Additives were each injected at 40 μM together with Fab30. Points are independent measurements (n = 3); open points show binding for additive alone. Means were compared by two-tailed unpaired t test. ns, p > 0.05; *p % 0.05, **p % 0.01, and ***p % 0.001. (D) The proportion of active-like βarr1 increases in the presence of PIP2.
Figure 7.
Figure 7.. Model for PIP regulation of GPCR-βarr complex assembly and disassembly
GPCRs stratify into two groups with respect to the strength of their interaction with βarrs: one group requires an interaction between βarrs and PIPs at the PM for recruitment (PIP required, left), whereas the other does not (PIP not required, right).

Similar articles

Cited by

References

    1. Asher WB, Terry DS, Gregorio GGA, Kahsai AW, Borgia A, Xie B, Modak A, Zhu Y, Jang W, Govindaraju A, et al. (2022). GPCR-mediated beta-arrestin activation deconvoluted with single-molecule precision. Cell 185, 1661–1675.e16. - PMC - PubMed
    1. Baidya M, Kumari P, Dwivedi-Agnihotri H, Pandey S, Chaturvedi M, Stepniewski TM, Kawakami K, Cao Y, Laporte SA, Selent J, et al. (2020). Key phosphorylation sites in GPCRs orchestrate the contribution of beta-arrestin 1 in ERK1/2 activation. EMBO Rep. 21, e49886. - PMC - PubMed
    1. Beyett TS, Fraley AE, Labudde E, Patra D, Coleman RC, Eguchi A, Glukhova A, Chen Q, Williams RM, Koch WJ, et al. (2019). Perturbation of the interactions of calmodulin with GRK5 using a natural product chemical probe. Proc. Natl. Acad. Sci. USA 116, 15895–15900. - PMC - PubMed
    1. Cahill TJ 3rd, Thomsen AR, Tarrasch JT, Plouffe B, Nguyen AH, Yang F, Huang LY, Kahsai AW, Bassoni DL, Gavino BJ, et al. (2017). Distinct conformations of GPCR-beta-arrestin complexes mediate desensitization, signaling, and endocytosis. Proc. Natl. Acad. Sci. USA 114, 2562–2567. - PMC - PubMed
    1. Chen Q, Zhuo Y, Sharma P, Perez I, Francis DJ, Chakravarthy S, Vishnivetskiy SA, Berndt S, Hanson SM, Zhan X, et al. (2021). An eight amino acid Segment Controls Oligomerization and Preferred Conformation of the two Non-visual arrestins. J. Mol. Biol 433, 166790. - PMC - PubMed

Publication types

MeSH terms

LinkOut - more resources