

Optimized Transcriptional Signature for Evaluation of MEK/ERK Pathway Baseline Activity and Long-Term Modulations in Ovarian Cancer
- PMID: 36362153
- PMCID: PMC9654336
- DOI: 10.3390/ijms232113365
Optimized Transcriptional Signature for Evaluation of MEK/ERK Pathway Baseline Activity and Long-Term Modulations in Ovarian Cancer
Abstract
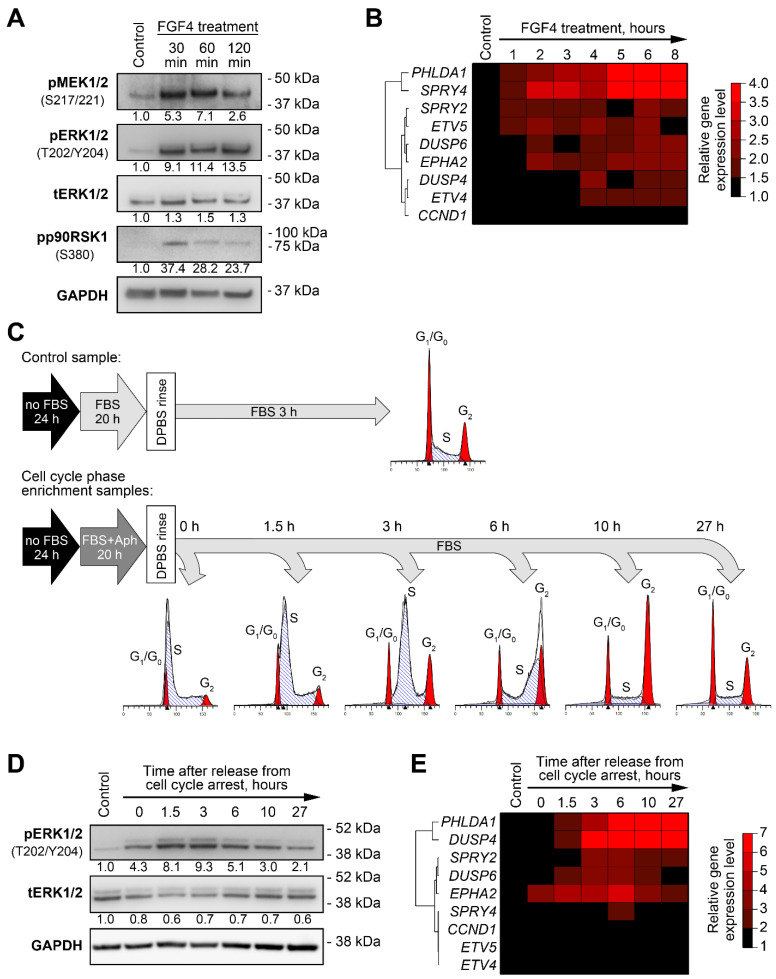
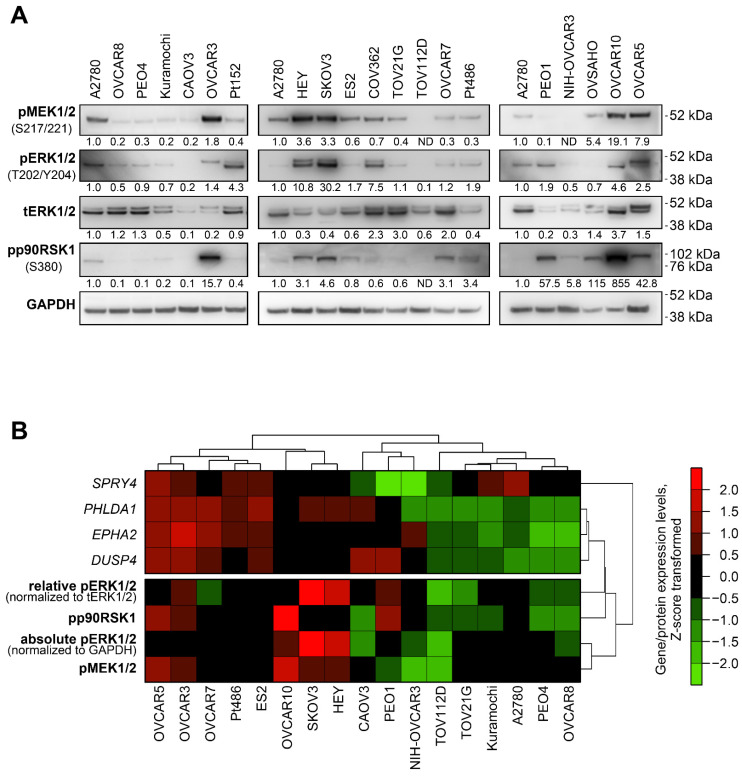
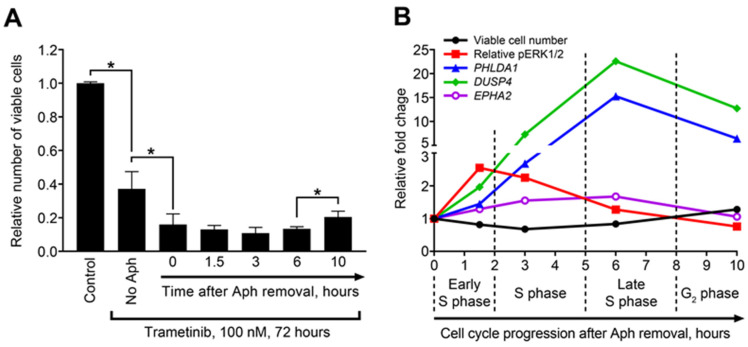
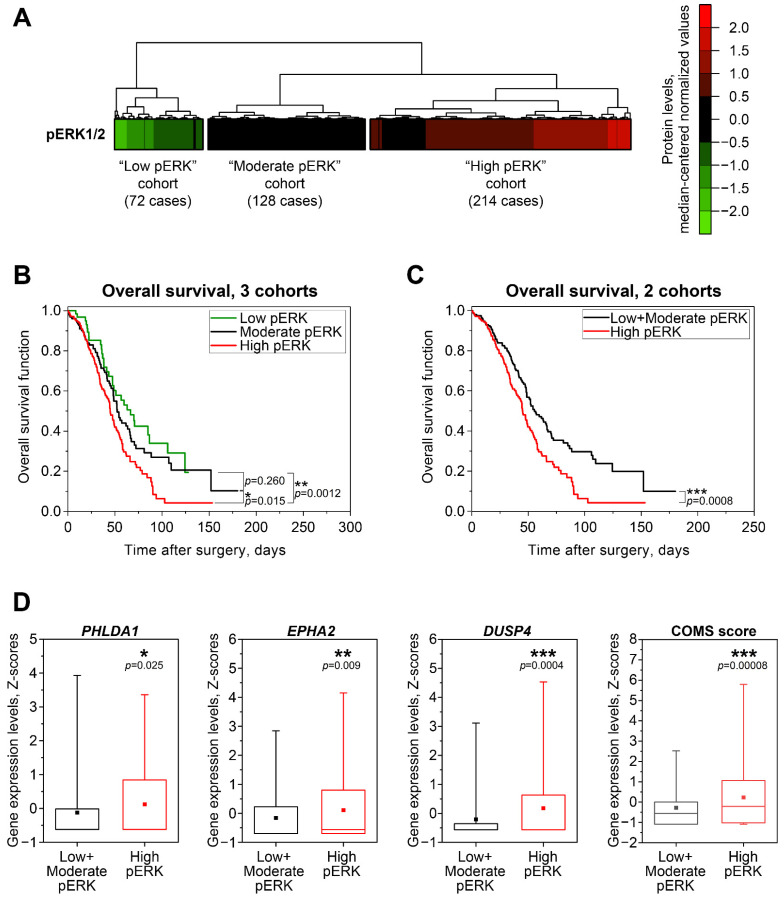
Ovarian cancer is the most aggressive and lethal of all gynecologic malignancies. The high activity of the MEK/ERK signaling pathway is tightly associated with tumor growth, high recurrence rate, and treatment resistance. Several transcriptional signatures were proposed recently for evaluation of MEK/ERK activity in tumor tissue. In the present study, we validated the performance of a robust multi-cancer MPAS 10-gene signature in various experimental models and publicly available sets of ovarian cancer samples. Expression of four MPAS genes (PHLDA1, DUSP4, EPHA2, and SPRY4) displayed reproducible responses to MEK/ERK activity modulations across several experimental models in vitro and in vivo. Levels of PHLDA1, DUSP4, and EPHA2 expression were also significantly associated with baseline levels of MEK/ERK pathway activity in multiple human ovarian cancer cell lines and ovarian cancer patient samples available from the TCGA database. Initial platinum therapy resistance and advanced age at diagnosis were independently associated with poor overall patient survival. Taken together, our results demonstrate that the performance of transcriptional signatures is significantly affected by tissue specificity and aspects of particular experimental models. We therefore propose that gene expression signatures derived from comprehensive multi-cancer studies should be always validated for each cancer type.
Keywords: MAPK; chemoresistance; ovarian cancer.
Conflict of interest statement
The authors indicated no potential conflict of interest.
Figures
Similar articles
-
miRNA-651-3p regulates EMT in ovarian cancer cells by targeting ZNF703 and via the MEK/ERK pathway.Biochem Biophys Res Commun. 2022 Sep 3;619:76-83. doi: 10.1016/j.bbrc.2022.06.005. Epub 2022 Jun 16. Biochem Biophys Res Commun. 2022. PMID: 35749939
-
[Expression and significance of MAPK/ERK in the specimens and cells of epithelial ovarian cancer].Zhonghua Fu Chan Ke Za Zhi. 2019 Aug 25;54(8):541-547. doi: 10.3760/cma.j.issn.0529-567x.2019.08.007. Zhonghua Fu Chan Ke Za Zhi. 2019. PMID: 31461811 Chinese.
-
The potential of RAS/RAF/MEK/ERK (MAPK) signaling pathway inhibitors in ovarian cancer: A systematic review and meta-analysis.Gynecol Oncol. 2023 Apr;171:83-94. doi: 10.1016/j.ygyno.2023.01.038. Epub 2023 Feb 24. Gynecol Oncol. 2023. PMID: 36841040 Review.
-
Betacellulin enhances ovarian cancer cell migration by up-regulating Connexin43 via MEK-ERK signaling.Cell Signal. 2020 Jan;65:109439. doi: 10.1016/j.cellsig.2019.109439. Epub 2019 Oct 22. Cell Signal. 2020. PMID: 31654720
-
MEK1/2 inhibitors in the treatment of gynecologic malignancies.Gynecol Oncol. 2014 Apr;133(1):128-37. doi: 10.1016/j.ygyno.2014.01.008. Epub 2014 Jan 14. Gynecol Oncol. 2014. PMID: 24434059 Review.
Cited by
-
Drug tolerant persister cell plasticity in cancer: A revolutionary strategy for more effective anticancer therapies.Signal Transduct Target Ther. 2024 Aug 14;9(1):209. doi: 10.1038/s41392-024-01891-4. Signal Transduct Target Ther. 2024. PMID: 39138145 Free PMC article. Review.
-
Multi-layered proteomics identifies insulin-induced upregulation of the EphA2 receptor via the ERK pathway which is dependent on low IGF1R level.Sci Rep. 2024 Nov 21;14(1):28856. doi: 10.1038/s41598-024-77817-5. Sci Rep. 2024. PMID: 39572596 Free PMC article.
-
ERBB2 as a prognostic biomarker correlates with immune infiltrates in papillary thyroid cancer.Front Genet. 2022 Nov 9;13:966365. doi: 10.3389/fgene.2022.966365. eCollection 2022. Front Genet. 2022. PMID: 36437939 Free PMC article.
References
MeSH terms
Substances
Grants and funding
LinkOut - more resources
Full Text Sources
Other Literature Sources
Medical
Miscellaneous
