

PTEN Loss Enhances Error-Prone DSB Processing and Tumor Cell Radiosensitivity by Suppressing RAD51 Expression and Homologous Recombination
- PMID: 36361678
- PMCID: PMC9658850
- DOI: 10.3390/ijms232112876
PTEN Loss Enhances Error-Prone DSB Processing and Tumor Cell Radiosensitivity by Suppressing RAD51 Expression and Homologous Recombination
Abstract
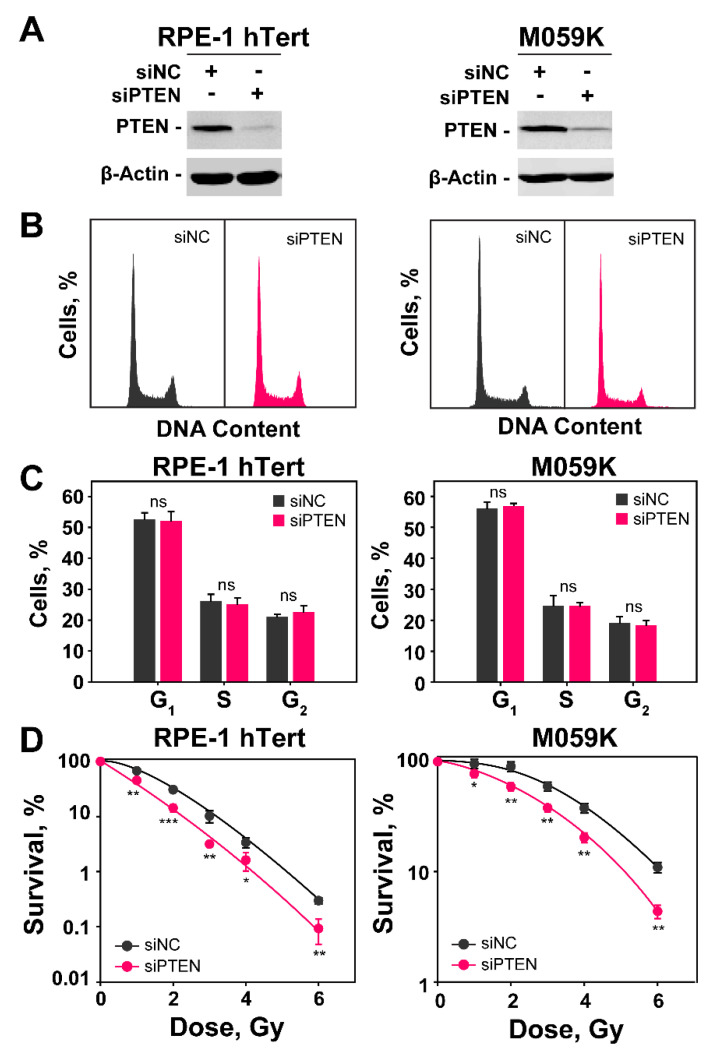
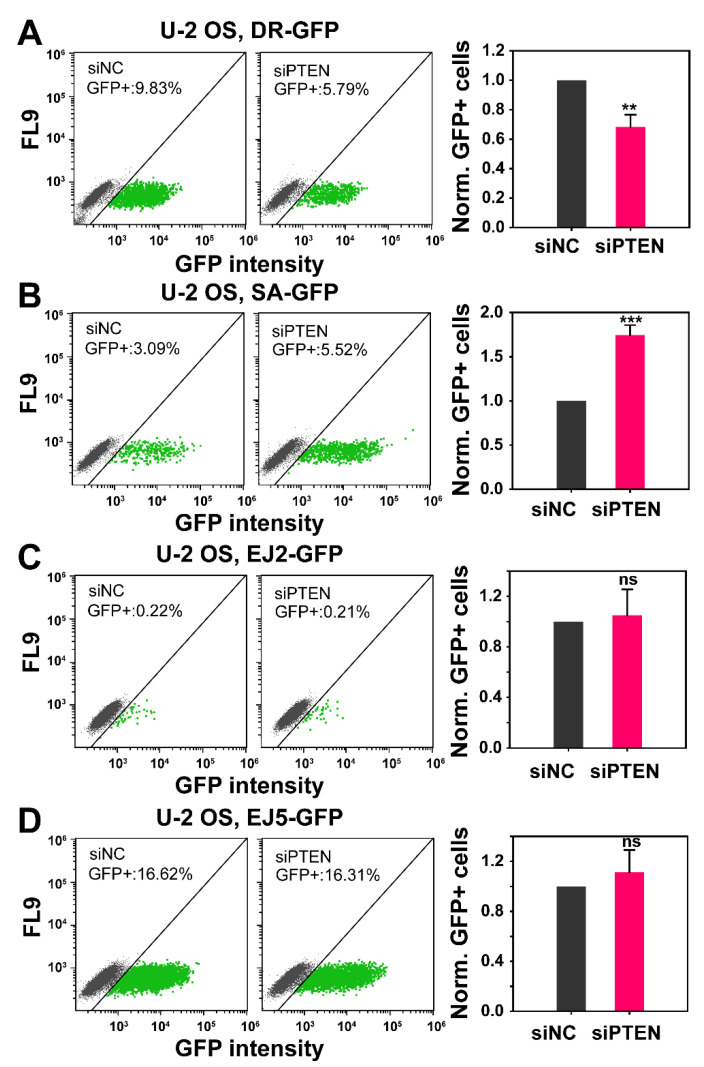
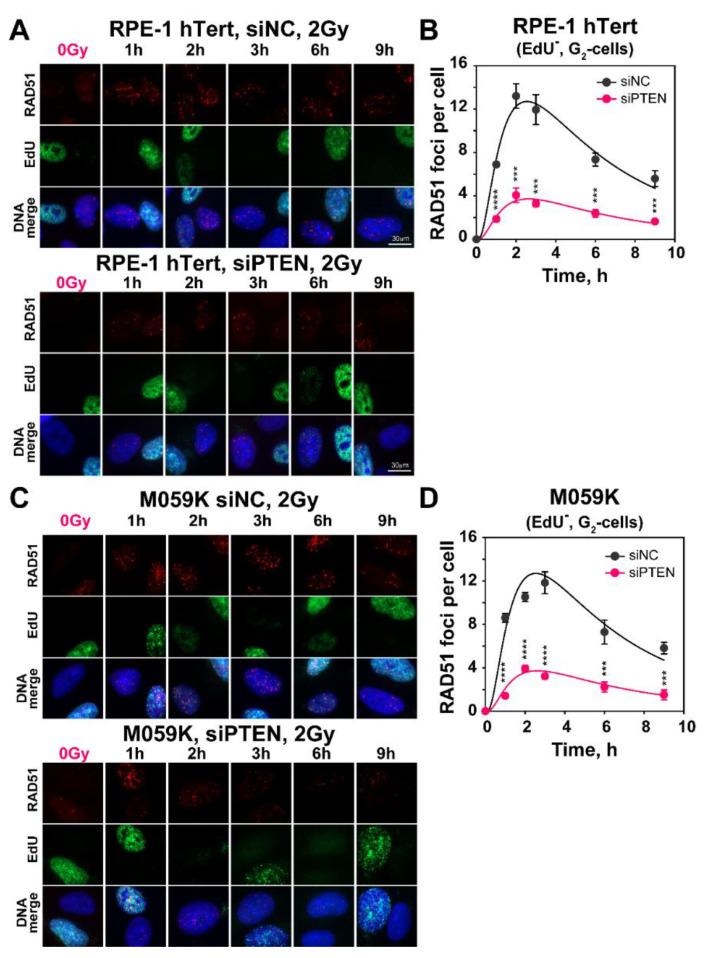
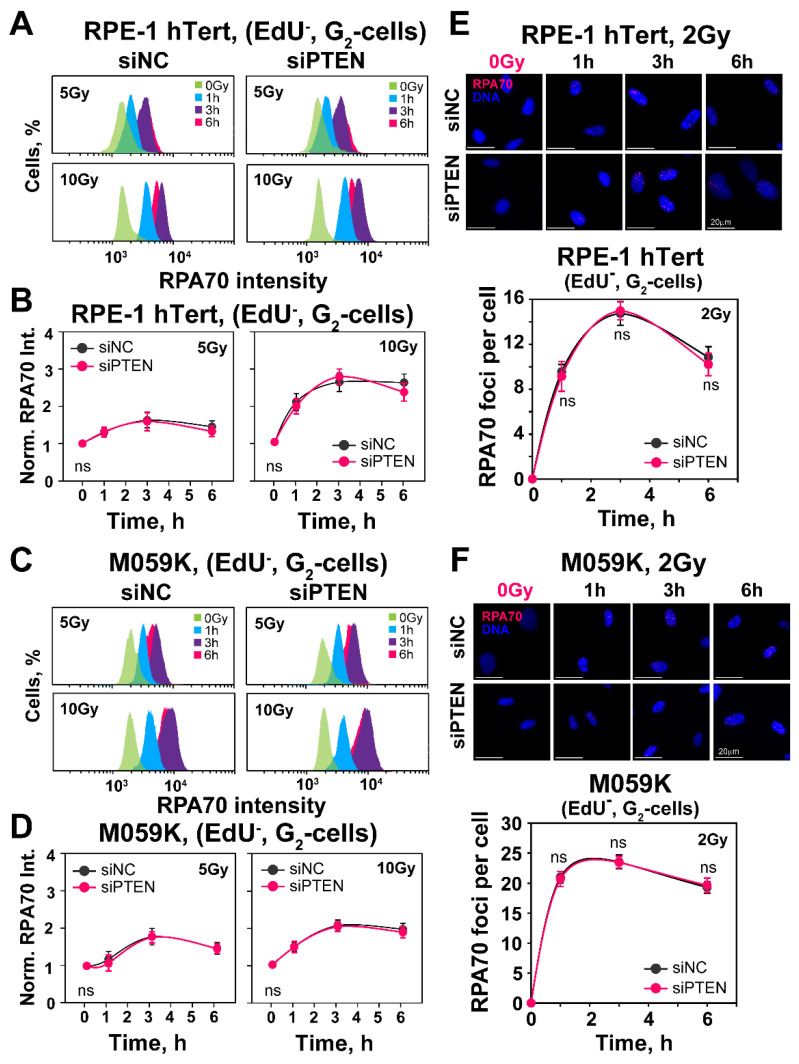
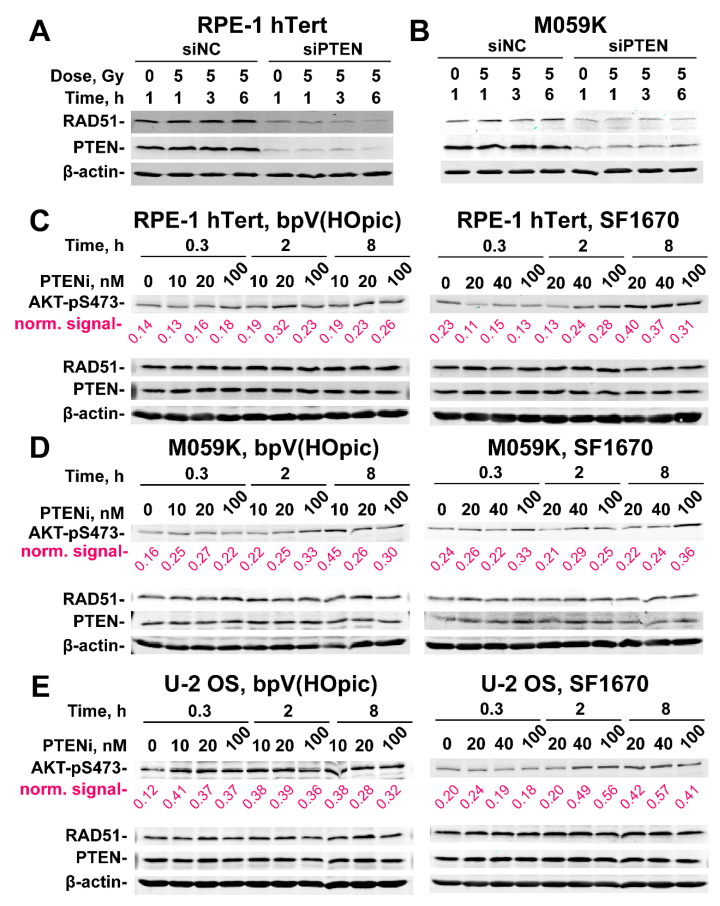
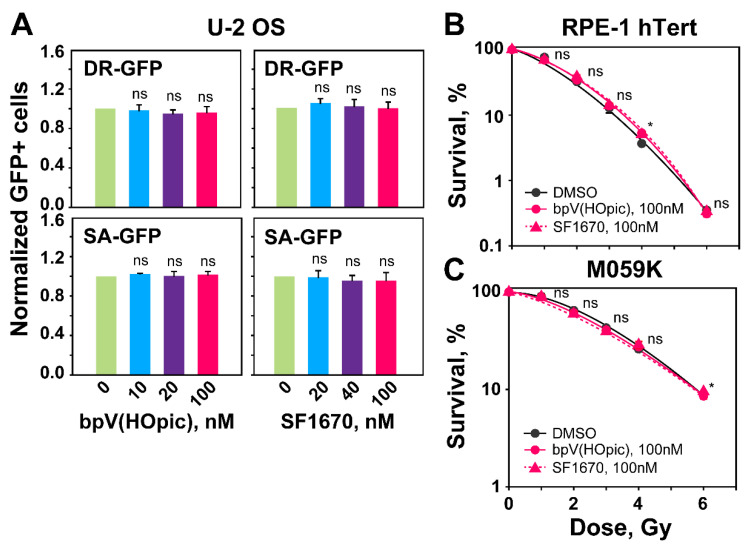
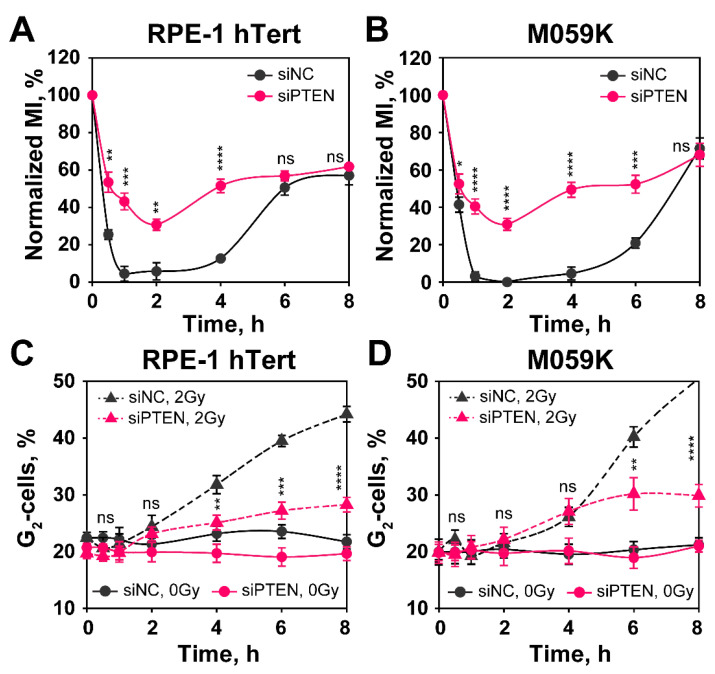
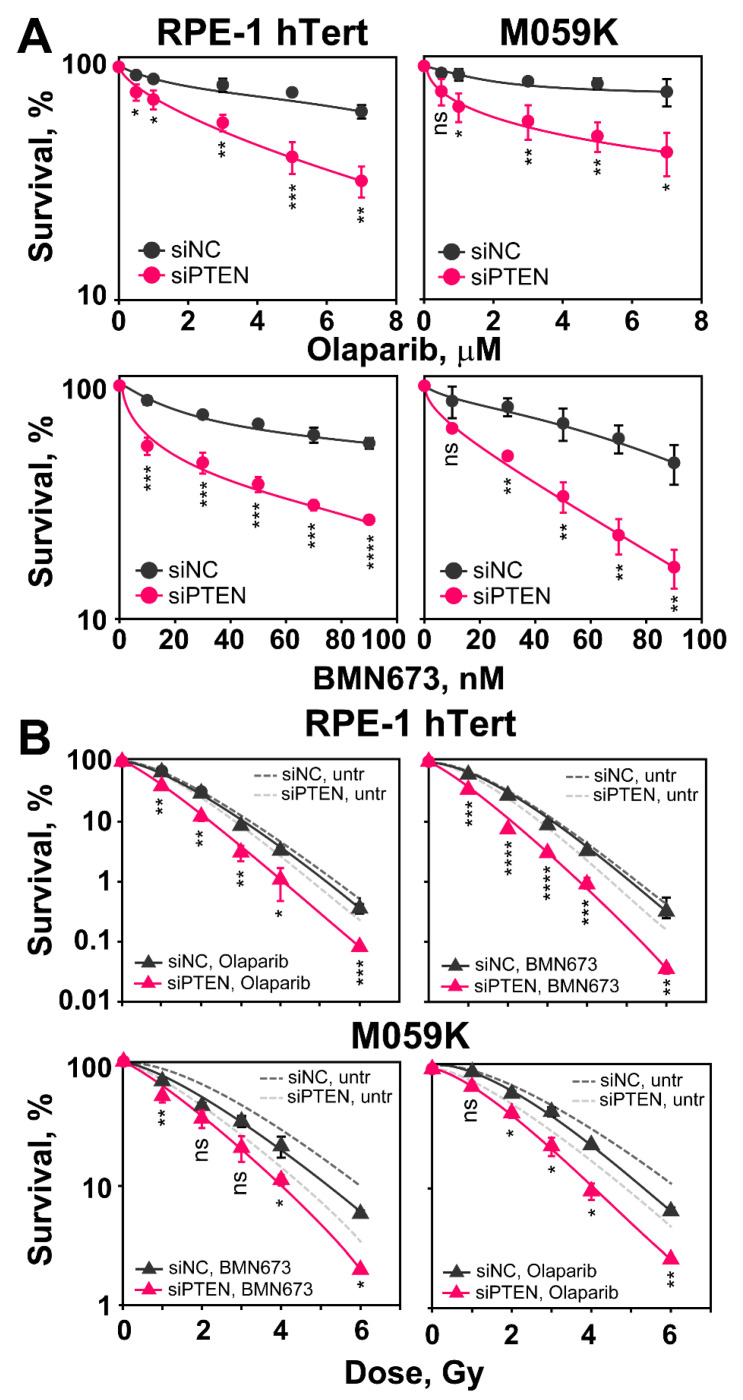
PTEN has been implicated in the repair of DNA double-strand breaks (DSBs), particularly through homologous recombination (HR). However, other data fail to demonstrate a direct role of PTEN in DSB repair. Therefore, here, we report experiments designed to further investigate the role of PTEN in DSB repair. We emphasize the consequences of PTEN loss in the engagement of the four DSB repair pathways-classical non-homologous end-joining (c-NHEJ), HR, alternative end-joining (alt-EJ) and single strand annealing (SSA)-and analyze the resulting dynamic changes in their utilization. We quantitate the effect of PTEN knockdown on cell radiosensitivity to killing, as well as checkpoint responses in normal and tumor cell lines. We find that disruption of PTEN sensitizes cells to ionizing radiation (IR). This radiosensitization is associated with a reduction in RAD51 expression that compromises HR and causes a marked increase in SSA engagement, an error-prone DSB repair pathway, while alt-EJ and c-NHEJ remain unchanged after PTEN knockdown. The G2-checkpoint is partially suppressed after PTEN knockdown, corroborating the associated HR suppression. Notably, PTEN deficiency radiosensitizes cells to PARP inhibitors, Olaparib and BMN673. The results show the crucial role of PTEN in DSB repair and show a molecular link between PTEN and HR through the regulation of RAD51 expression. The expected benefit from combination treatment with Olaparib or BMN673 and IR shows that PTEN status may also be useful for patient stratification in clinical treatment protocols combining IR with PARP inhibitors.
Keywords: DDR; DSBs; HR; PARP inhibitors; PTEN; SSA; alt-EJ; c-NHEJ; ionizing radiation.
Conflict of interest statement
The authors declare no conflict of interest.
Figures
Similar articles
-
New Facets of DNA Double Strand Break Repair: Radiation Dose as Key Determinant of HR versus c-NHEJ Engagement.Int J Mol Sci. 2023 Oct 6;24(19):14956. doi: 10.3390/ijms241914956. Int J Mol Sci. 2023. PMID: 37834403 Free PMC article. Review.
-
Disruption of Chromatin Dynamics by Hypotonic Stress Suppresses HR and Shifts DSB Processing to Error-Prone SSA.Int J Mol Sci. 2021 Oct 11;22(20):10957. doi: 10.3390/ijms222010957. Int J Mol Sci. 2021. PMID: 34681628 Free PMC article.
-
Analysis of chromatid-break-repair detects a homologous recombination to non-homologous end-joining switch with increasing load of DNA double-strand breaks.Mutat Res Genet Toxicol Environ Mutagen. 2021 Jul;867:503372. doi: 10.1016/j.mrgentox.2021.503372. Epub 2021 Jun 12. Mutat Res Genet Toxicol Environ Mutagen. 2021. PMID: 34266628
-
Increased Gene Targeting in Hyper-Recombinogenic LymphoBlastoid Cell Lines Leaves Unchanged DSB Processing by Homologous Recombination.Int J Mol Sci. 2022 Aug 16;23(16):9180. doi: 10.3390/ijms23169180. Int J Mol Sci. 2022. PMID: 36012445 Free PMC article.
-
Alternative end-joining repair pathways are the ultimate backup for abrogated classical non-homologous end-joining and homologous recombination repair: Implications for the formation of chromosome translocations.Mutat Res Genet Toxicol Environ Mutagen. 2015 Nov;793:166-75. doi: 10.1016/j.mrgentox.2015.07.001. Epub 2015 Jul 4. Mutat Res Genet Toxicol Environ Mutagen. 2015. PMID: 26520387 Review.
Cited by
-
Reversible and effective cell cycle synchronization method for studying stage-specific investigations.bioRxiv [Preprint]. 2024 Sep 3:2024.09.02.610832. doi: 10.1101/2024.09.02.610832. bioRxiv. 2024. PMID: 39282459 Free PMC article. Preprint.
-
DNA damage response in breast cancer and its significant role in guiding novel precise therapies.Biomark Res. 2024 Sep 27;12(1):111. doi: 10.1186/s40364-024-00653-2. Biomark Res. 2024. PMID: 39334297 Free PMC article. Review.
-
Moving the Needle Forward in Genomically-Guided Precision Radiation Treatment.Cancers (Basel). 2023 Nov 7;15(22):5314. doi: 10.3390/cancers15225314. Cancers (Basel). 2023. PMID: 38001574 Free PMC article. Review.
-
New Facets of DNA Double Strand Break Repair: Radiation Dose as Key Determinant of HR versus c-NHEJ Engagement.Int J Mol Sci. 2023 Oct 6;24(19):14956. doi: 10.3390/ijms241914956. Int J Mol Sci. 2023. PMID: 37834403 Free PMC article. Review.
-
Nuclear PTEN's Functions in Suppressing Tumorigenesis: Implications for Rare Cancers.Biomolecules. 2023 Jan 30;13(2):259. doi: 10.3390/biom13020259. Biomolecules. 2023. PMID: 36830628 Free PMC article. Review.
References
-
- Steck P.A., Pershouse M.A., Jasser S.A., Yung W.K., Lin H., Ligon A.H., Langford L.A., Baumgard M.L., Hattier T., Davis T., et al. Identification of a candidate tumour suppressor gene, MMAC1, at chromosome 10q23.3 that is mutated in multiple advanced cancers. Nat. Genet. 1997;15:356–362. doi: 10.1038/ng0497-356. - DOI - PubMed
-
- Dragoo D.D., Taher A., Wong V.K., Elsaiey A., Consul N., Mahmoud H.S., Mujtaba B., Stanietzky N., Elsayes K.M. PTEN Hamartoma Tumor Syndrome/Cowden Syndrome: Genomics, Oncogenesis, and Imaging Review for Associated Lesions and Malignancy. Cancers. 2021;13:3120. doi: 10.3390/cancers13133120. - DOI - PMC - PubMed
-
- Hendricks L.A.J., Schuurs-Hoeijmakers J., Spier I., Haadsma M.L., Eijkelenboom A., Cremer K., Mensenkamp A.R., Aretz S., Vos J.R., Hoogerbrugge N. Catch them if you are aware: PTEN postzygotic mosaicism in clinically suspicious patients with PTEN Hamartoma Tumour Syndrome and literature review. Eur. J. Med. Genet. 2022;65:104533. doi: 10.1016/j.ejmg.2022.104533. - DOI - PubMed
MeSH terms
Substances
Grants and funding
LinkOut - more resources
Full Text Sources
Research Materials
