. 2022 Nov 10;13(11):947.
doi: 10.1038/s41419-022-05339-x.

Novel protein complexes containing autophagy and UPS components regulate proteasome-dependent PARK2 recruitment onto mitochondria and PARK2-PARK6 activity during mitophagy

Affiliations

Novel protein complexes containing autophagy and UPS components regulate proteasome-dependent PARK2 recruitment onto mitochondria and PARK2-PARK6 activity during mitophagy

Nur Mehpare Kocaturk et al. Cell Death Dis. .

Abstract

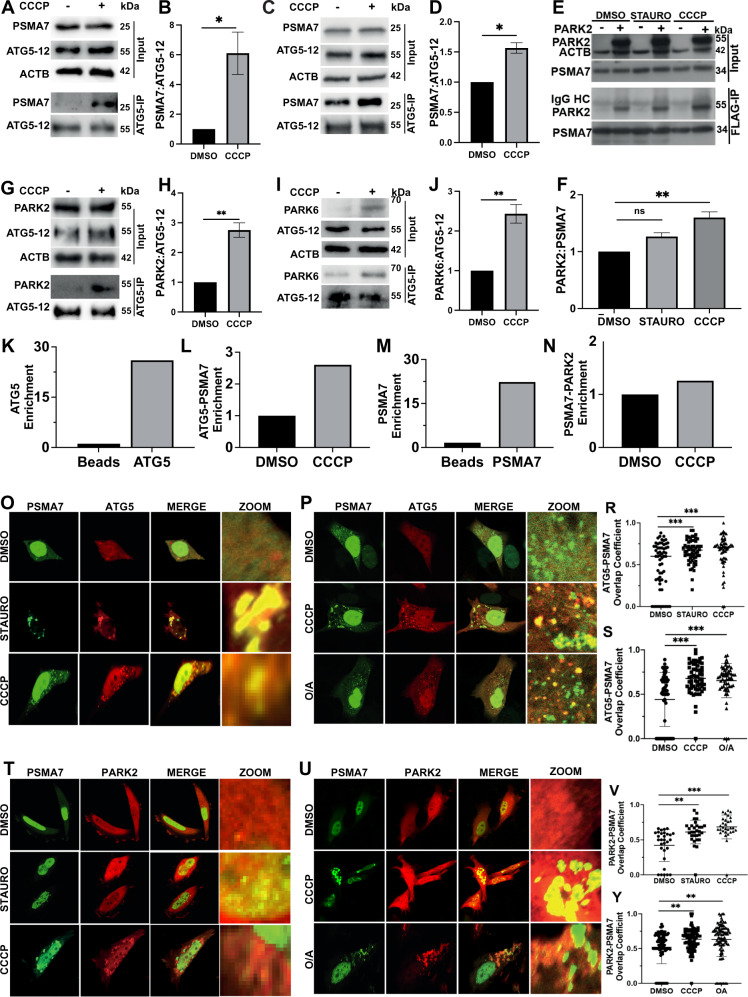
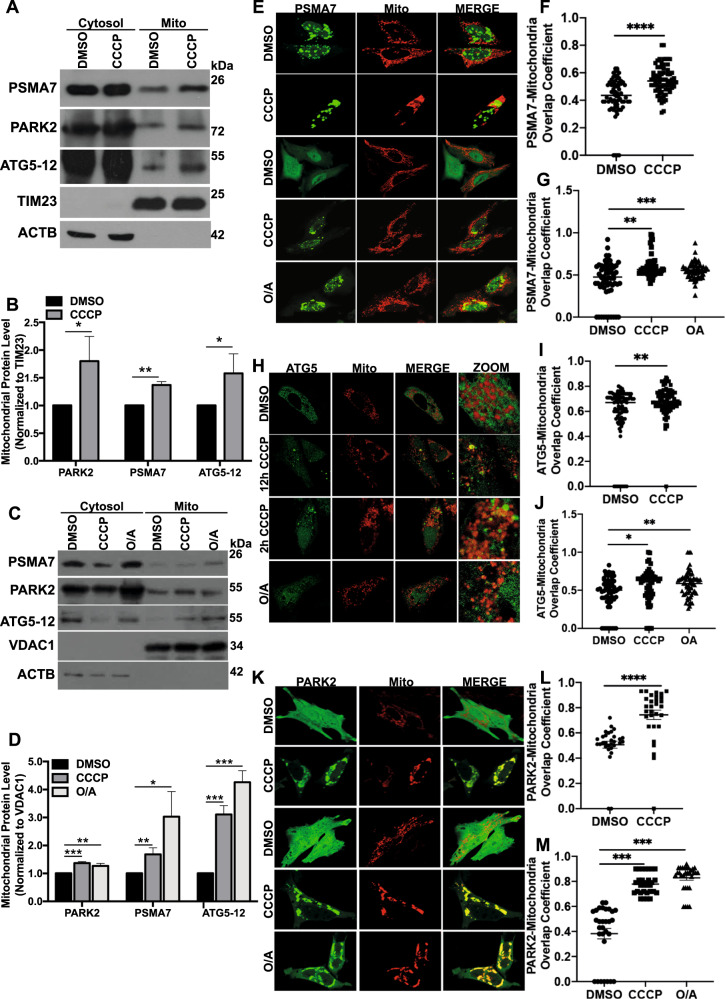
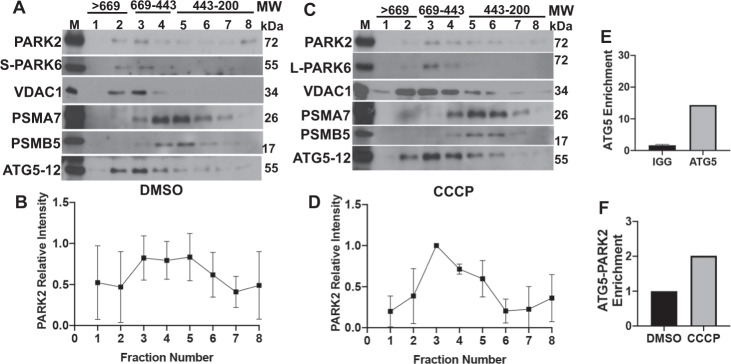
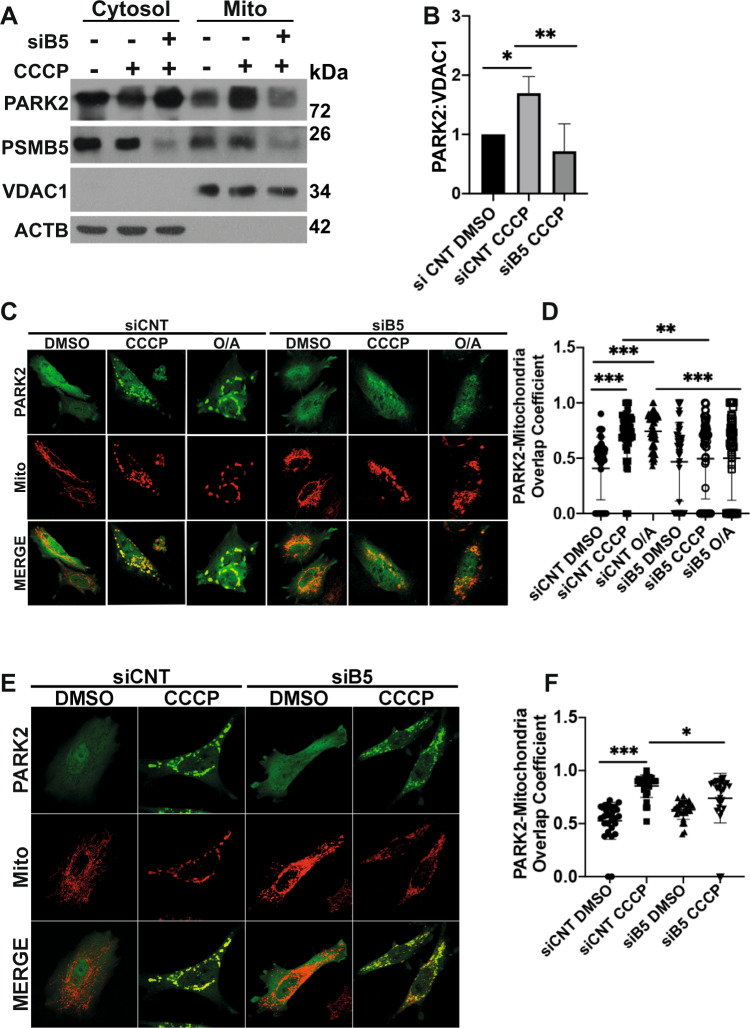
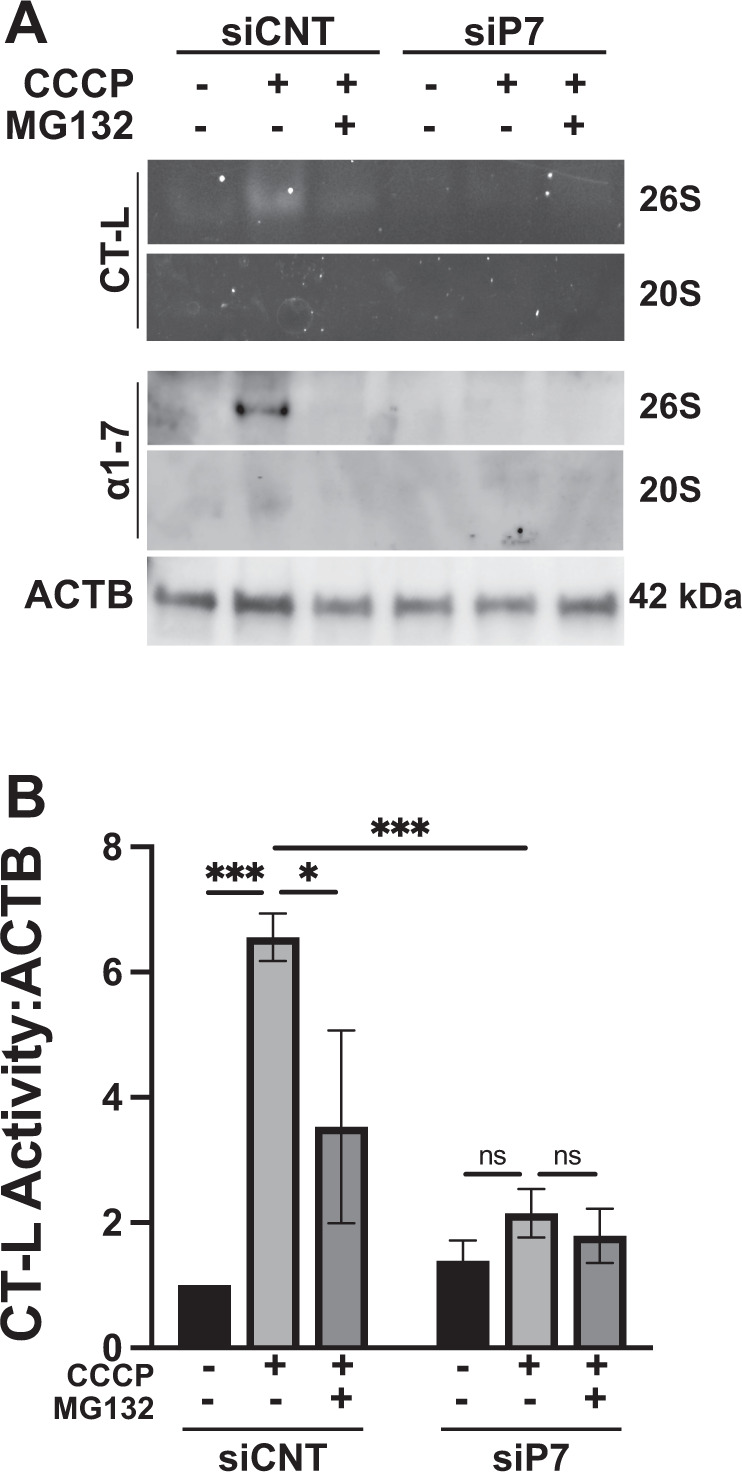
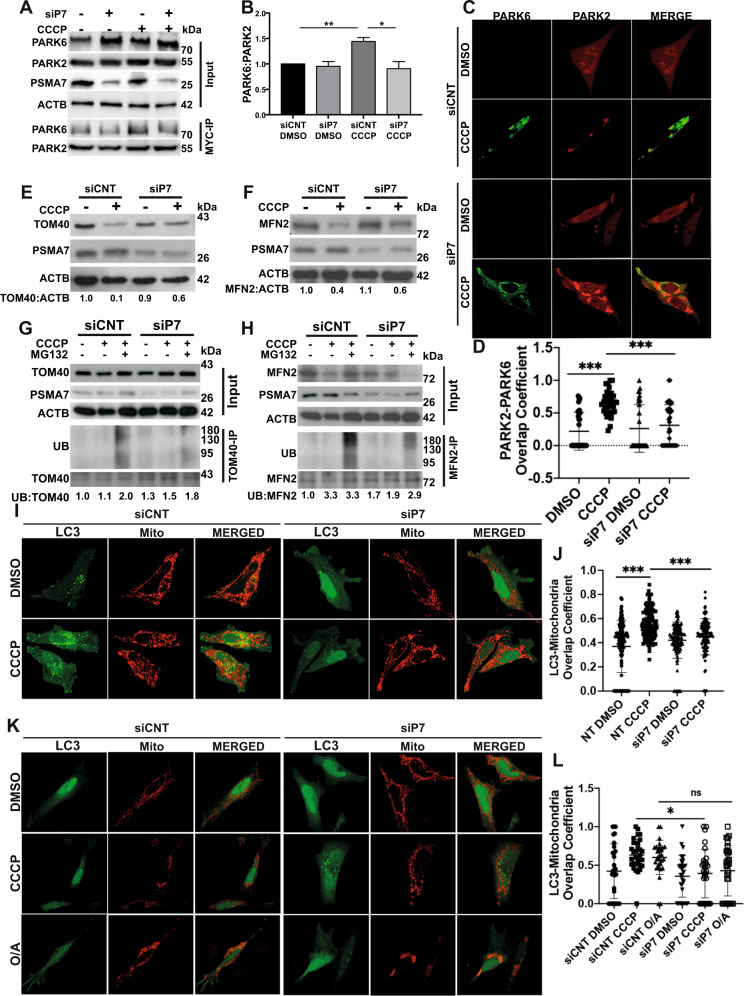
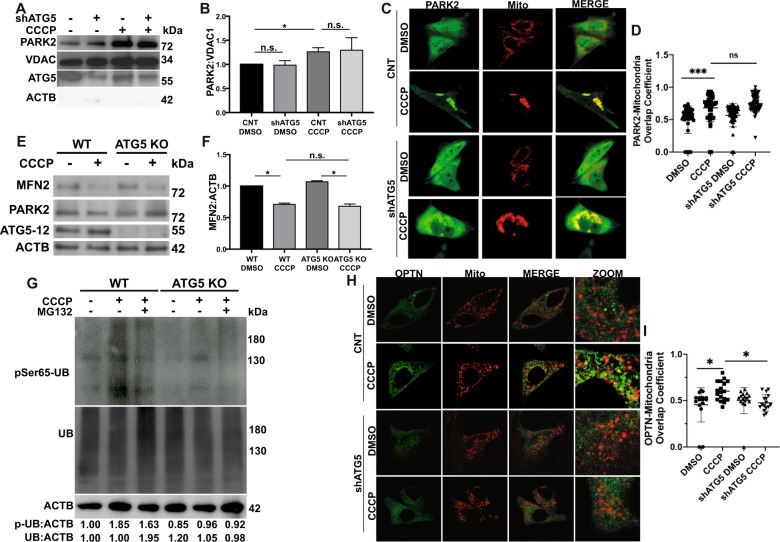
Autophagy is an evolutionarily conserved eukaryotic cellular mechanism through which cytosolic fragments, misfolded/aggregated proteins and organelles are degraded and recycled. Priming of mitochondria through ubiquitylation is required for the clearance the organelle by autophagy (mitophagy). Familial Parkinson's Disease-related proteins, including the E3-ligase PARK2 (PARKIN) and the serine/threonine kinase PARK6 (PINK1) control these ubiquitylation reactions and contribute to the regulation of mitophagy. Here we describe, novel protein complexes containing autophagy protein ATG5 and ubiquitin-proteasome system (UPS) components. We discovered that ATG5 interacts with PSMA7 and PARK2 upon mitochondrial stress. Results suggest that all three proteins translocate mitochondria and involve in protein complexes containing autophagy, UPS and mitophagy proteins. Interestingly, PARK2 and ATG5 recruitment onto mitochondria requires proteasome components PSMA7 and PSMB5. Strikingly, we discovered that subunit of 20 S proteasome, PSMA7, is required for the progression of PARK2-PARK6-mediated mitophagy and the proteasome activity following mitochondrial stress. Our results demonstrate direct, dynamic and functional interactions between autophagy and UPS components that contribute to the regulation of mitophagy.


Conflict of interest statement

The authors have no conflicts of interest to declare. All co-authors have seen and agree with the contents of the manuscript and there is no financial interest to report. The authors declare no competing interests.

Figures

Fig. 1
Fig. 1. Mitochondrial stress promotes the interaction of autophagy and UPS components.
A Representative western blot image showing endogenous PSMA7 and ATG5-12 protein levels in total cell lysate (Input) and ATG5-immunoprecipitated lysate (ATG5-IP) in HEK 293 T cells. Actin beta (ACTB) was used as loading control. B Graph representing the levels of immunoprecipitated PSMA7 protein with ATG5-12, normalized to ATG5-12 in HEK 293 T cells (mean ± SEM, n = 3). C Representative western blot image showing endogenous PSMA7 and ATG5-12 protein levels in total cell lysate (Input) and ATG5-immunoprecipitated lysate (ATG5-IP) in MEF cells. ACTB was used as loading control. D Graph representing the levels of immunoprecipitated PSMA7 protein with ATG5-12, normalized to ATG5-12 in MEF cells (mean ± SEM, n = 3). E Representative images of immunoprecipitation of FLAG and western blot analysis of PARK2 and PSMA7 in HEK 293 T cells co-transfected with MYC-PARK2 and/or FLAG-PSMA7. HEK 293 T cells were treated with STAURO (1 μM), CCCP (10 μM) or DMSO for 12 h after transfection and immunoprecipitation using Flag beads. F Quantification of PARK2 protein levels immunoprecipitated with PSMA7 from E, normalized to PSMA7 (mean ± SEM, n = 3). G and I, Representative western blot images showing the levels of PARK2 and PARK6 proteins respectively, immunoprecipitated with endogenous ATG5 in HA-PARK2 expressing HEK 293 T cells following DMSO or CCCP treatment (10 μM) for 12 h. H and J, Graphs showing the quantification of PARK2 (from G) and PARK6 (from I) protein levels, normalized to endogenous ATG5-12 (mean ± SEM, n = 3). K and L, SILAC-MS/MS-based interactome results as fold change graphs of ATG5 enrichment (K) and CCCP-induced PSMA7-ATG5 complex enrichment (L) as compared to control. M and N, Fold change graphs of PSMA7 enrichment (M) and CCCP-induced PARK2-PSMA7 complex enrichment (N). O and P, Confocal microscopy images of HEK 293 T cells co-transfected with GFP-PSMA7 (green) and pmCherry-ATG5 (red) constructs and treated with CCCP (10 μM) or STAURO for 12 h (O) and treated with CCCP (20 μM) or Oligomycin A/Antimycin A (O/A, 10 μM) for 2 h (P). R and S, overlap coefficiency graphs representing PSMA7 (green) and ATG5 (red) colocalization following 12 h (R) and 2 h (S) of treatments (n = 60). T and U, Confocal microscopy images of HeLa cells that were co-transfected with pEGFP-PSMA7 (green) and pmCherry-PARK2 (red) constructs, and treated with staurosporine (1 μM, 12 h) or CCCP (10 μM, 12 h) (T) and CCCP or O/A for 2 h (U). V and Y, Overlap coefficiency graphs representing PSMA7 (green) and PARK2 (red) colocalization after 12 h (V, n = 30) and 2 h (Y, n = 91) of treatments. MERGE, overlay of green and red signals. ZOOM, zoomed images of particular area. Significance in R, S, V and Y was determined using one-way ANOVA.
Fig. 2
Fig. 2. ATG5, PSMA7 and PARK2 translocated onto mitochondria upon mitochondrial stress.
A Representative western blot images showing PSMA7, PARK2, ATG5-12, TIM23 and Actin beta (ACTB) protein levels in cytoplasmic (Cytosol) and mitochondrial (Mito) fractions of YFP-PARK2 transfected HEK 293 T cells treated with DMSO or CCCP (10 µM, 12 h). B Quantification graph corresponding to mitochondrial protein levels of PARK2, PSMA7 and ATG5-12 in A. Mitochondrial protein levels were normalized to TIM23 (mean ± S.D., n = 3). C Representative western blot images showing PSMA7, PARK2, ATG5-12, VDAC1, and ACTB protein levels in cytoplasmic (Cytosol) and mitochondrial (Mito) fractions of HA-PARK2 overexpressing HeLa cells treated with DMSO or CCCP (20 µM, 2 h) or O/A (10 µM, 2 h). D Quantification graph corresponding to protein levels of PARK2, PSMA7 and ATG5-12 in C. Mitochondrial protein levels were normalized to VDAC1 (mean ± S.D., n = 3). E Confocal microscopy analysis of HeLa cells co-transfected with pEGFP-PSMA7 (green) and mito-dsRed (red) constructs, and treated with DMSO or CCCP for 12 h (upper panel) and DMSO, CCCP or O/A for 2 h (lower panel). MERGE, overlay of green and red signals. F and G Overlap coefficiency graphs representing PSMA7 (green) and mitochondria (red) colocalization during 12 h (F, n = 68) and 2 h (G, n = 62) treatments. H Confocal microscopy analysis of HeLa cells co-transfected with YFP-ATG5 (green) and mito-dsRed (red) constructs and treated with DMSO or CCCP for 12 h (upper panel) and CCCP or O/A for 2 h (lower panel). I and J Overlap coefficiency graphs representing ATG5 (green) and mitochondria (red) colocalization during 12 h (I, n = 87) and 2 h (J, n = 60) treatments. K Confocal microscopy analysis of HeLa cells that were co-transfected with YFP-PARK2 (green) and mito-dsRed (red) constructs and treated with DMSO or CCCP 12 h (upper panel) and DMSO, CCCP or O/A for 2 h (lower panel). L and M, Overlap coefficiency graphs representing PARK2 (green) and mitochondria (red) colocalization during 12 h (L, n = 30) and 2 h (M, n = 30) treatments. MERGE, overlay of green and red signals. Ordinary one-way ANOVA test (G, J and M) or two-tail t-test (F, I and L) used for statistical analysis.
Fig. 3
Fig. 3. Identification of novel protein complexes that assemble under basal or mitochondrial stress conditions.
A and C, Western blot images representing the levels of PARK2, PARK6, VDAC1, PSMA7, PSMB5 and ATG5-12 following gel filtration chromatography performed using mitochondrial lysates collected from YFP-PARK2 expressing HEK 293 T cells treated with either DMSO (A), or CCCP (C) for 12 h. M, mitochondrial extracts before fractionation. L-PARK6, uncleaved/unprocessed form of PARK6 (63 kDa). S-PARK6, cleaved/processed form of PARK6 (55 kDa). B and D, Quantifications of PARK2 relative intensity in A and C respectively (n = 3). E and F, Graphs showing SILAC-MS/MS enrichments of ATG5 (E) and PARK2-ATG5 complex (F) in mitochondrial fraction (n = 3).
Fig. 4
Fig. 4. 20 S proteasome subunit PSMA7 and proteasomal activity are indispensable for PARK2 recruitment to mitochondria.
A, Representative western blot images showing PARK2, PSMA7, VDAC1 and actin beta (ACTB) protein levels in cytosolic (Cytosol) and mitochondrial (Mito) fractions of YFP-PARK2 expressing HEK 293 T cells transfected with control, non-targeting siRNAs (siCNT) or PSMA7-targeting siRNAs, (siP7) and treated with DMSO or CCCP (10 µM) for 12 h. B Quantification graph representing mitochondrial PARK2 levels normalized to VDAC1 from A (mean ± SEM, n = 3). C and E, Confocal microscopy analysis of YFP-PARK2 (green) and mito-dsRed (red) expressing and siCNT or siP7 transfected HeLa cells after 2 h (C, DMSO, 20 µM CCCP or 10 µM O/A) and 12 h (E, DMSO or 20 µM CCCP) of indicated treatments. MERGE, overlay of green and red signals. D and F Graphs showing quantifications of overlap coefficient of PARK2 and mitochondria (mito-dsRed) from C and E respectively (mean ± S.D., n≥30, one-way ANOVA).
Fig. 5
Fig. 5. 20 S proteasome subunit PSMB5 and proteasomal activity are indispensable for PARK2 recruitment to mitochondria.
A Representative western blot images showing PARK2, PSMB5, VDAC1 and actin beta (ACTB) protein levels in cytosolic (Cytosol) and mitochondrial (Mito) fractions of YFP-PARK2 expressing HEK 293 T cells transfected with control, non-targeting siRNAs (siCNT) or PSMB5-targeting siRNAs, (siB5) and treated with DMSO or CCCP (10 µM) for 12 h. B Quantification graph representing mitochondrial PARK2 levels normalized to VDAC1 from A (mean ± SEM, n = 3). C and E, Confocal microscopy analysis of YFP-PARK2 (green) and mito-dsRed (red) expressing and siCNT or siB5 transfected HeLa cells after 2 h (C, DMSO, 20 µM CCCP or 10 µM O/A) and 12 h (E, DMSO or 20 µM CCCP) of indicated treatments. MERGE, overlay of green and red signals. D and F Graphs showing quantifications of overlap coefficient of PARK2 and mitochondria (mito-dsRed) from C and E respectively (mean ± S.D., n ≥ 30, one-way ANOVA).
Fig. 6
Fig. 6. Knockdown of PSMA7 alters CCCP-induced assembly of the proteasome subunits and proteasome activity.
A Representative native gel (upper two panels) and western blot (lower two panels) images of the 26 S and 20 S subunits of the proteasome in HA-PARK2 expressing HEK 293 T cells transfected with control siRNA (siCNT) or PSMA7 siRNA (siP7), and treated with DMSO or CCCP (20 µM) for 2 h in the absence or presence of proteasome inhibitor MG132 (2.5 h, 30 µM). Actin beta (ACTB) was used as loading control. B Graph representing the in-gel chymotrypsin (CT-L) proteasome activity from A (mean ± SEM, n = 3).
Fig. 7
Fig. 7. PSMA7 is required for PARK2-dependent mitophagy-related processes.
A Representative western blot images showing PARK6, PARK2 and PSMA7 protein levels in total cell lysate (Input) and MYC-immunoprecipitated lysate (MYC-IP) of HEK 293 T cells transfected with MYC-PARK2 and GFP-PARK6 and either non-targeting control siRNA (siCNT) or PSMA7-targeting siRNA (siP7) and treated with DMSO or CCCP (10 µM) for 12 h. Actin beta (ACTB) was used as loading control. B Graph representing protein levels of PARK6 immunoprecipitated with MYC-PARK2 from A (mean ± SEM, n = 3). C Confocal microscopy analysis of GFP-PARK6 (green) and mCherry-PARK2 (red) expressing HeLa cells co-transfected with siCNT or siP7, and treated with DMSO or CCCP (10 µM) for 12 h. MERGE, overlay of green and red signals. D Quantification of PARK2/PARK6 overlap coefficient of microscopy analysis represented in C (mean ± S.D., n ≥ 30, one-way ANOVA). E and F Representative western blot images of TOM40 (E) and MFN2 (F) levels in MYC-PARK2 expressing HEK 293 T cells co-transfected with siCNT or siP7 and treated with either DMSO or CCCP (10 µM) for 12 h. ACTB was used as loading control. Band intensities were provided below (n = 3). G and H Representative western blot images of ubiquitin levels in TOM40 (G) and MFN2 (H) immunoprecipitated lysates of MYC-PARK2 expressing HEK 293 T cells co-transfected with siCNT or siP7, and treated with DMSO, CCCP (20 µM) or MG132 (30 µM) and CCCP (20 µM) for 2 h. ACTB was used as loading control. Band intensities were provided below (n = 3). I and K, Confocal analyses of MYC-PARK2, GFP-LC3 (green) and mito-dsRed (red) expressing HeLa cells co-transfected with siCNT or siP7, and treated with DMSO or CCCP for 12 h (I) and treated with DMSO, CCCP or O/A for 2 h (K). J and L, Quantification of overlap coeefficiency values of LC3 (green) and mitochondria (red) from I and K respectively (mean ± S.D., n ≥ 40, one-way ANOVA).
Fig. 8
Fig. 8. ATG5 is not required for PARK2 recruitment onto mitochondria, but is indispensable for mitophagy.
A,Representative western blot images of PARK2, VDAC1, ATG5-12 and ACTB in mitochondrial fractions of YFP-PARK2 expressing HEK 293 T cells transfected with control vector or ATG5 specific shRNA vector (shATG5), and treated with DMSO or CCCP (10 µM) for 12 h. B Graph representing the quantification of mitochondria localized PARK2 from A (mean ± SEM, n = 3). C Representative confocal images of YFP-PARK2 (green) and mito-dsRed (red) expressing HeLa cells co-transfected with control vector (CNT) or shATG5 vector, and treated with DMSO or CCCP (10 µM) for 12 h. MERGE, overlay of green and red signals. D Graph showing colocalization coefficiency of PARK2 overlap with mitochondria from C (mean ± S.D., n≥30, one-way ANOVA). E Representative western blot images of MFN2, PARK2, ATG5-12 and ACTB in MYC-PARK2 over expressing wild type (WT) and ATG5 knockout (KO) HeLa cells treated with DMSO or CCCP (10 µM) for 12 h. ACTB was used as loading control. F, Quantification of MFN2 levels from E (mean ± SEM, n = 3). G, Representative western blot images of phosphoSer65-ubiquitin (pSer65-UB) and total ubiquitin (UB) levels in MYC-PARK2 expressing wild type (WT) and ATG5 knockout (KO) HeLa cells treated with DMSO, CCCP (20 μM, 2 h) or MG132 (30 μM, 2.5 h) and CCCP (20 μM, 2.5 h). Band intensities were marked below (n = 3). H Confocal images of GFP-optineurin (OPTN, green) and mito-dsRed (red) expressing HeLa cells co-transfected with control vector or shATG5 vector, and treated with DMSO or CCCP (10 μM) for 12 h. MERGE, overlay of green and red signals. ZOOM, zoomed images of particular area. I Quantification graph showing the overlap coefficiency values of optineurin dots (green) and mitochondria (red) from H (mean ± S.D., n ≥ 30, one-way ANOVA).

Similar articles

Cited by

References

    1. Mizushima N. Autophagy: Process and function. Genes Dev. 2007;21:2861–73. - PubMed
    1. Chen Y, Klionsky DJ. The regulation of autophagy - Unanswered questions. J Cell Sci. 2011;124:161–70. - PMC - PubMed
    1. Walker S, Chandra P, Manifava M, Axe E, Ktistakis NT. Making autophagosomes: Localized synthesis of phosphatidylinositol 3-phosphate holds the clue. Autophagy. 2008;4:1093–6. - PubMed
    1. Mizushima N, Kuma A, Kobayashi Y, Yamamoto A, Matsubae M, Takao T, et al. Mouse Apg16L, a novel WD-repeat protein, targets to the autophagic isolation membrane with the Apg12-Apg5 conjugate. J Cell Sci. 2003;116:1679–88. - PubMed
    1. Mizushima N, Komatsu M. Autophagy: Renovation of cells and tissues. Cell. 2011;147:728–41. - PubMed

Publication types

MeSH terms

Supplementary concepts