. 2022 Oct 31;15(11):1346.
doi: 10.3390/ph15111346.

Andrographolide Promotes Uptake of Glucose and GLUT4 Transport through the PKC Pathway in L6 Cells

Affiliations

Andrographolide Promotes Uptake of Glucose and GLUT4 Transport through the PKC Pathway in L6 Cells

Jingya Liao et al. Pharmaceuticals (Basel). .

Abstract

Glucose transporter 4 (GLUT4) is a membrane protein that regulates blood glucose balance and is closely related to type 2 diabetes. Andrographolide (AND) is a diterpene lactone extracted from herbal medicine Andrographis paniculata, which has a variety of biological activities. In this study, the antidiabetic effect of AND in L6 cells and its mechanism were investigated. The uptake of glucose of L6 cells was detected by a glucose assay kit. The expression of GLUT4 and phosphorylation of protein kinase B (PKB/Akt), AMP-dependent protein kinase (AMPK), and protein kinase C (PKC) were detected by Western blot. At the same time, the intracellular Ca2+ levels and GLUT4 translocation in myc-GLUT4-mOrange-L6 cells were detected by confocal laser scanning microscopy. The results showed that AND enhanced the uptake of glucose, GLUT4 expression and fusion with plasma membrane in L6 cells. Meanwhile, AND also significantly activated the phosphorylation of AMPK and PKC and increased the concentration of intracellular Ca2+. AND-induced GLUT4 expression was significantly inhibited by a PKC inhibitor (Gö6983). In addition, in the case of 0 mM extracellular Ca2+ and 0 mM extracellular Ca2+ + 10 μM BAPTA-AM (intracellular Ca2+ chelator), AND induced the translocation of GLUT4, and the uptake of glucose was significantly inhibited. Therefore, we concluded that AND promoted the expression of GLUT4 and its fusion with plasma membrane in L6 cells through PKC pathways in a Ca2+-dependent manner, thereby increasing the uptake of glucose.

Keywords: Ca2+; GLUT4; L6 cells; andrographolide; type 2 diabetes.


Conflict of interest statement

The authors declare no conflict of interest.

Figures

Figure 1
Figure 1
AND was the major component in AP-EtOAc. (A) HPLC analysis of AP-EtOAc shown at 254 nm. (B) HPLC analysis of AND shown at 254 nm.
Figure 2
Figure 2
AP-EtOAc promoted the uptake of glucose and enhanced GLUT4 transport in L6 cells. (A) Values on the Y-axis represent the fold relationship of glucose uptake by L6 cells compared with that in normal conditions. Uptake of glucose detected using a Glucose oxidase kit in L6 cells, the data represent the mean ± s.e.m. of values from three separate experiments. The control group was considered as 1 for data analysis. (B) Values on the Y-axis represent the fold relationship of glucose uptake by L6 cells compared with that in normal conditions. Uptake of glucose in L6 cells induced by AP-EtOAc in insulin resistant L6 cells, the data represent the mean ± s.e.m. of values from three separate experiments. (C) Images of 60 μg/mL AP-EtOAc stimulating GLUT4 transport in L6 cells. Scale bar = 50 μm. (D) Calculation of fluorescence intensity in myc-GLUT4-mOrange-L6 cells using Zen 2010 software, n = 30 cells. *: p < 0.05; **: p < 0.01, ***: p < 0.001.
Figure 3
Figure 3
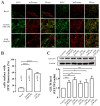
AP-EtOAc enhanced GLUT4 protein expression and GLUT4 fusion with the plasma membrane in L6 cells. (A) FITC fluorescence assay in myc-GLUT4-mOrange cells treated with 60μg/mL AP-EtOAc or 100 nM insulin. Scale bar: 5 μm in single cell image, 50 μm in multi-cell image. (B) Number of GLUT4-mOrange-positive cells, the data represent the mean ± s.e.m. of values from three separate experiments with between 200 and 300 cells being examined in each experiment. (C) The expression level of GLUT4 after treated with 100 nM insulin or different concentrations of AP-EtOAc for 30 min in L6 cells. The control group was considered as 1 for data analysis. The data represent the mean ± s.e.m. of values from three separate experiment. *: p < 0.05; **: p < 0.01, ***: p < 0.001.
Figure 4
Figure 4
AND promoted the uptake of glucose in L6 cells. (A) Chemical structure of AND. (B) Values on the Y-axis represent the fold relationship of glucose uptake by L6 cells compared with that in normal conditions. Uptake of glucose in L6 cells under the incubation of AND or insulin, the data represent the mean ± s.e.m. of values from three separate experiments. (C) Toxicity of AND to L6 cells, the data represent the mean ± s.e.m. of values from three separate experiments. (D) Values on the Y-axis represent the fold relationship of glucose uptake by L6 cells compared with that in normal conditions. Uptake of glucose in L6 cells induced by AND in insulin-resistant L6 cells, the data represent the mean ± s.e.m. of values from three separate experiments. **: p < 0.01; ***: p < 0.001.
Figure 5
Figure 5
AND promoted GLUT4 expression and fusion into plasma membrane. (A) FITC fluorescence analysis of L6 cells treated with AND or Insulin. Scale bar: 10 μm for single-cell images and 50 μm for multi-cell images. (B) The number of GLUT4-mOrange-positive cells, the data represent the mean ± s.e.m. of values from three separate experiments with between 200 and 300 cells examined in each experiment. (C) The expression level of GLUT4 after treatment with 100 nM insulin or different concentrations of AND for 30 min in L6 cells. The control group was considered as 1 for data analysis. The data represent the mean ± s.e.m. of values from three separate experiments. *: p < 0.05; **: p < 0.01; ****: p < 0.0001.
Figure 6
Figure 6
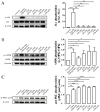
AND induced phosphorylation of PKC and AMPK signaling pathways. (A) The phosphorylation of Akt in L6 cells treatment with insulin and different concentrations of AND. The control group was considered as 1 for data analysis. The data represent the mean ± s.e.m. of values from three separate experiments. (B) The phosphorylation of AMPK in L6 cells treatment with metformin and different concentrations of AND. The control group was considered as 1 for data analysis. The data represent the mean ± s.e.m. of values from three separate experiments. (C) The phosphorylation of PKC in L6 cells treatment with PMA and different concentrations of AND. The control group was considered as 1 for data analysis. The data represent the mean ± s.e.m. of values from three separate experiments. *: p < 0.05; **: p < 0.01; ***: p < 0.001; ****: p < 0.0001.
Figure 7
Figure 7
AND induced GLUT4 expression through the PKC signaling pathway. The control group was considered as 1 for data analysis. The expression of GLUT4 induced by AND under the action of three inhibitors. ns: p >0.05; *: p < 0.05; **: p < 0.01.
Figure 8
Figure 8
AND induced increased Ca2+ concentration in L6 cells. (A) Images of Ca2+ concentration changes in L6 cells treated with AND. Scale bar: 50 μm. (B) The change of intracellular Ca2+ fluorescence intensity caused by AND within 30 min, n = 15 cells. ****: p < 0.0001.
Figure 9
Figure 9
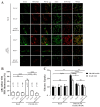
Translocation of GLUT4 and uptake of glucose induced by AND in L6 cells blocked by 0 mM extracellular Ca2+ and 0 mM extracellular Ca2+ + 10 μM BAPTA-AM. (A) L6 cells were stimulated by AND under the conditions of 2 mM extracellular Ca2+, 0 mM extracellular Ca2+, and 0 mM extracellular Ca2+ + 10 μM BAPTA-AM. The distribution of red and green fluorescence in L6 cells was detected by confocal laser scanning microscopy. Scale bar: 10 μm for single-cell images and 50 μm for multi-cell images. (B) The number of GLUT4-mOrange-positive cells data represent the mean ± s.e.m. of values from three separate experiments, with between 200 and 300 cells examined in each experiment. (C) Uptake of glucose induced by insulin or AND in the three Ca2+ buffering systems. The three groups on the left are the control group, and the three groups on the right represent glucose uptake after adding insulin and AND. The data represent the mean ± s.e.m. of values from three separate experiments. ns: p > 0.05; *: p < 0.05; **: p < 0.01; ****: p < 0.0001.
Figure 10
Figure 10
Proposed model of the AND-induced increase of glucose uptake in L6 cells.

Similar articles

Cited by

References

    1. Saeedi P., Petersohn I., Salpea P., Malanda B., Karuranga S., Unwin N., Colagiuri S., Guariguata L., Motala A.A., Ogurtsova K., et al. Global and regional diabetes prevalence estimates for 2019 and projections for 2030 and 2045: Results from the International Diabetes Federation Diabetes Atlas, 9(th) edition. Diabetes Res. Clin. Pract. 2019;157:107843. doi: 10.1016/j.diabres.2019.107843. - DOI - PubMed
    1. Cole J.B., Florez J.C. Genetics of diabetes mellitus and diabetes complications. Nat. Rev. Nephrol. 2020;16:377–390. doi: 10.1038/s41581-020-0278-5. - DOI - PMC - PubMed
    1. Petersen M.C., Shulman G.I. Mechanisms of Insulin Action and Insulin Resistance. Physiol. Rev. 2018;98:2133–2223. doi: 10.1152/physrev.00063.2017. - DOI - PMC - PubMed
    1. Haeusler R.A., McGraw T.E., Accili D. Biochemical and cellular properties of insulin receptor signalling. Nat. Rev. Mol. Cell Biol. 2018;19:31–44. doi: 10.1038/nrm.2017.89. - DOI - PMC - PubMed
    1. Stumvoll M., Goldstein B.J., van Haeften T.W. Type 2 diabetes: Principles of pathogenesis and therapy. Lancet. 2005;365:1333–1346. doi: 10.1016/S0140-6736(05)61032-X. - DOI - PubMed

Grants and funding

The research received financial support from National Natural Science Foundation of China grants (31070744, 81573561 and 81774000); Key Laboratory Construction of Hubei Province (2018BFC360); Open Project of Hubei Provincial Key Laboratory for Protection and Application of Special Plant Germplasm in Wuling Area of China (WLSP202002), and Hubei Medical Biology International Science and Technology Cooperation Base.

LinkOut - more resources