Force- and cell state-dependent recruitment of Piezo1 drives focal adhesion dynamics and calcium entry
- PMID: 36351022
- PMCID: PMC9645726
- DOI: 10.1126/sciadv.abo1461
Force- and cell state-dependent recruitment of Piezo1 drives focal adhesion dynamics and calcium entry
Abstract
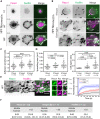
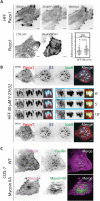
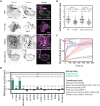
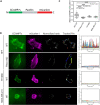
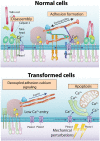
Mechanosensing is an integral part of many physiological processes including stem cell differentiation, fibrosis, and cancer progression. Two major mechanosensing systems-focal adhesions and mechanosensitive ion channels-can convert mechanical features of the microenvironment into biochemical signals. We report here unexpectedly that the mechanosensitive calcium-permeable channel Piezo1, previously perceived to be diffusive on plasma membranes, binds to matrix adhesions in a force-dependent manner, promoting cell spreading, adhesion dynamics, and calcium entry in normal but not in most cancer cells tested except some glioblastoma lines. A linker domain in Piezo1 is needed for binding to adhesions, and overexpression of the domain blocks Piezo1 binding to adhesions, decreasing adhesion size and cell spread area. Thus, we suggest that Piezo1 is a previously unidentified component of focal adhesions in nontransformed cells that catalyzes adhesion maturation and growth through force-dependent calcium signaling, but this function is absent in most cancer cells.
Figures



Similar articles
-
Joining forces: crosstalk between mechanosensitive PIEZO1 ion channels and integrin-mediated focal adhesions.Biochem Soc Trans. 2023 Oct 31;51(5):1897-1906. doi: 10.1042/BST20230042. Biochem Soc Trans. 2023. PMID: 37772664 Review.
-
α-Catenin and Piezo1 Mediate Cell Mechanical Communication via Cell Adhesions.Biology (Basel). 2024 May 19;13(5):357. doi: 10.3390/biology13050357. Biology (Basel). 2024. PMID: 38785839 Free PMC article.
-
A Feedforward Mechanism Mediated by Mechanosensitive Ion Channel PIEZO1 and Tissue Mechanics Promotes Glioma Aggression.Neuron. 2018 Nov 21;100(4):799-815.e7. doi: 10.1016/j.neuron.2018.09.046. Epub 2018 Oct 18. Neuron. 2018. PMID: 30344046
-
Store-Operated Ca2+ Entry Contributes to Piezo1-Induced Ca2+ Increase in Human Endometrial Stem Cells.Int J Mol Sci. 2022 Mar 29;23(7):3763. doi: 10.3390/ijms23073763. Int J Mol Sci. 2022. PMID: 35409116 Free PMC article.
-
Mechanosensing by Piezo1 and its implications for physiology and various pathologies.Biol Rev Camb Philos Soc. 2022 Apr;97(2):604-614. doi: 10.1111/brv.12814. Epub 2021 Nov 15. Biol Rev Camb Philos Soc. 2022. PMID: 34781417 Review.
Cited by
-
Piezo1 Is Required for Myoblast Migration and Involves Polarized Clustering in Association with Cholesterol and GM1 Ganglioside.Cells. 2023 Dec 7;12(24):2784. doi: 10.3390/cells12242784. Cells. 2023. PMID: 38132106 Free PMC article.
-
Membrane curvature governs the distribution of Piezo1 in live cells.Nat Commun. 2022 Dec 3;13(1):7467. doi: 10.1038/s41467-022-35034-6. Nat Commun. 2022. PMID: 36463216 Free PMC article.
-
The role and regulation of integrins in cell migration and invasion.Nat Rev Mol Cell Biol. 2024 Sep 30. doi: 10.1038/s41580-024-00777-1. Online ahead of print. Nat Rev Mol Cell Biol. 2024. PMID: 39349749 Review.
-
Extracellular matrix stiffness mediates insulin secretion in pancreatic islets via mechanosensitive Piezo1 channel regulated Ca2+ dynamics.Matrix Biol Plus. 2024 May 17;22:100148. doi: 10.1016/j.mbplus.2024.100148. eCollection 2024 Jun. Matrix Biol Plus. 2024. PMID: 38803329 Free PMC article.
-
Mechanical Constraints in Tumor Guide Emergent Spatial Patterns of Glioblastoma Cancer Stem Cells.Mechanobiol Med. 2024 Mar;2(1):100027. doi: 10.1016/j.mbm.2023.100027. Epub 2023 Oct 29. Mechanobiol Med. 2024. PMID: 38770108 Free PMC article.
References
-
- Geiger B., Spatz J. P., Bershadsky A. D., Environmental sensing through focal adhesions. Nat. Rev. Mol. Cell Biol. 10, 21–33 (2009). - PubMed
-
- Vogel V., Sheetz M., Local force and geometry sensing regulate cell functions. Nat. Rev. Mol. Cell Biol. 7, 265–275 (2006). - PubMed
-
- Li J., Hou B., Tumova S., Muraki K., Bruns A., Ludlow M. J., Sedo A., Hyman A. J., McKeown L., Young R. S., Yuldasheva N. Y., Majeed Y., Wilson L. A., Rode B., Bailey M. A., Kim H. R., Fu Z., Carter D. A. L. L., Bilton J., Imrie H., Ajuh P., Dear T. N., Cubbon R. M., Kearney M. T., Prasad K. R., Evans P. C., Ainscough J. F. X. X., Beech D. J., Piezo1 integration of vascular architecture with physiological force. Nature 515, 279–282 (2014). - PMC - PubMed
-
- Bershadsky A. D., Balaban N. Q., Geiger B., Adhesion-dependent cell mechanosensitivity. Annu. Rev. Cell Dev. Biol. 19, 677–695 (2003). - PubMed
LinkOut - more resources
Full Text Sources
Research Materials

