Postnatal depletion of maternal cells biases T lymphocytes and natural killer cells' profiles toward early activation in the spleen
- PMID: 36349799
- PMCID: PMC9672855
- DOI: 10.1242/bio.059334
Postnatal depletion of maternal cells biases T lymphocytes and natural killer cells' profiles toward early activation in the spleen
Abstract
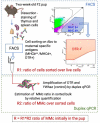
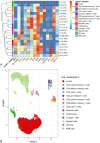
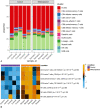
The maternal cells transferred into the fetus during gestation persist long after birth in the progeny. These maternal cells have been hypothesized to promote the maturation of the fetal immune system in utero but there are still significant gaps in our knowledge of their potential roles after birth. To provide insights into these maternal cells' postnatal functional roles, we set up a transgenic mouse model to specifically eliminate maternal cells in the neonates by diphtheria toxin injection and confirmed significant depletion in the spleens. We then performed immunophenotyping of the spleens of two-week-old pups by mass cytometry to pinpoint the immune profile differences driven by the depletion of maternal cells in early postnatal life. We observed a heightened expression of markers related to activation and maturation in some natural killer and T cell populations. We hypothesize these results to indicate a potential postnatal regulation of lymphocytic responses by maternal cells. Together, our findings highlight an immunological influence of maternal microchimeric cells postnatally, possibly protecting against adverse hypersensitivity reactions of the neonate at a crucial time of new encounters with self and environmental antigens.
Keywords: Maternal Cells; Microchimerism; Neonatal Immunity.
© 2022. Published by The Company of Biologists Ltd.
Conflict of interest statement
Competing interests The authors declare no competing or financial interests.
Figures


Similar articles
-
Pregnancy-induced transfer of pathogen-specific T cells from mother to fetus in mice.EMBO Rep. 2023 Oct 9;24(10):e56829. doi: 10.15252/embr.202356829. Epub 2023 Aug 23. EMBO Rep. 2023. PMID: 37610043 Free PMC article.
-
Early changes in T lymphocytes and subsets of mouse progeny defective as adults in controlling growth of a syngeneic tumor after in utero insult with benzo(a)pyrene.Immunopharmacology. 1987 Sep;14(1):1-10. doi: 10.1016/0162-3109(87)90003-8. Immunopharmacology. 1987. PMID: 3500149
-
Affinity-dependent alterations of mouse B cell development by noninherited maternal antigen.Biol Reprod. 2005 Feb;72(2):460-9. doi: 10.1095/biolreprod.104.035048. Epub 2004 Oct 6. Biol Reprod. 2005. PMID: 15469995
-
Emergent roles of maternal microchimerism in postnatal development.Dev Growth Differ. 2023 Jan;65(1):75-81. doi: 10.1111/dgd.12830. Epub 2022 Dec 26. Dev Growth Differ. 2023. PMID: 36519824 Review.
-
Immunological relationship between the mother and the fetus.Int Rev Immunol. 2002 Nov-Dec;21(6):471-95. doi: 10.1080/08830180215017. Int Rev Immunol. 2002. PMID: 12650238 Review.
Cited by
-
Development and comparison of immunologic assays to detect primary RSV infections in infants.Front Immunol. 2024 Jan 12;14:1332772. doi: 10.3389/fimmu.2023.1332772. eCollection 2023. Front Immunol. 2024. PMID: 38283339 Free PMC article.
-
Quantification of Female Chimeric Cells in the Tonsils of Male Children and Their Determinants.Cells. 2023 Aug 21;12(16):2116. doi: 10.3390/cells12162116. Cells. 2023. PMID: 37626925 Free PMC article.
-
Deciphering the Role of Maternal Microchimerism in Offspring Autoimmunity: A Narrative Review.Medicina (Kaunas). 2024 Sep 5;60(9):1457. doi: 10.3390/medicina60091457. Medicina (Kaunas). 2024. PMID: 39336498 Free PMC article. Review.
References
-
- Altman, M. C., Whalen, E., Togias, A., O'Connor, G. T., Bacharier, L. B., Bloomberg, G. R., Kattan, M., Wood, R. A., Presnell, S., LeBeau, P.et al. (2018). Allergen-induced activation of natural killer cells represents an early-life immune response in the development of allergic asthma. J. Allergy Clin. Immunol. 142, 1856-1866. 10.1016/j.jaci.2018.02.019 - DOI - PMC - PubMed
-
- Balle, C., Armistead, B., Kiravu, A., Song, X., Happel, A. U., Hoffmann, A. A., Kanaan, S. B., Nelson, J. L., Gray, C. M., Jaspan, H. B.et al. (2022). Factors influencing maternal microchimerism throughout infancy and its impact on infant T cell immunity. J. Clin. Invest. 132, e148826. 10.1172/JCI148826 - DOI - PMC - PubMed
Publication types
MeSH terms
Grants and funding
LinkOut - more resources
Full Text Sources
Other Literature Sources
Molecular Biology Databases

