. 2023 Feb;50(3):742-755.
doi: 10.1007/s00259-022-06019-w. Epub 2022 Nov 9.

TSPO expression in a Zika virus murine infection model as an imaging target for acute infection-induced neuroinflammation

Affiliations

TSPO expression in a Zika virus murine infection model as an imaging target for acute infection-induced neuroinflammation

Carla Bianca Luena Victorio et al. Eur J Nucl Med Mol Imaging. 2023 Feb.

Abstract

Introduction: Zika virus (ZIKV) is a neurotropic human pathogen that causes neuroinflammation, whose hallmark is elevated translocator protein (TSPO) expression in the brain. This study investigates ZIKV-associated changes in adult brain TSPO expression, evaluates the effectiveness of TSPO radioligands in detecting TSPO expression, and identifies cells that drive brain TSPO expression in a mouse infection model.

Methods: The interferon-deficient AG129 mouse infected with ZIKV was used as neuroinflammation model. TSPO expression was evaluated by tissue immunostaining. TSPO radioligands, [3H]PK11195 and [18F]FEPPA, were used for in vitro and ex vivo detection of TSPO in infected brains. [18F]FEPPA-PET was used for in vivo detection of TSPO expression. Cell subsets that contribute to TSPO expression were identified by flow cytometry.

Results: Brain TSPO expression increased with ZIKV disease severity. This increase was contributed by TSPO-positive microglia and infiltrating monocytes; and by influx of TSPO-expressing immune cells into the brain. [3H]PK11195 and [18F]FEPPA distinguish ZIKV-infected brains from normal controls in vitro and ex vivo. [18F]FEPPA brain uptake by PET imaging correlated with disease severity and neuroinflammation. However, TSPO expression by immune cells contributed to significant blood pool [18F]FEPPA activity which could confound [18F]FEPPA-PET imaging results.

Conclusions: TSPO is a biologically relevant imaging target for ZIKV neuroinflammation. Brain [18F]FEPPA uptake can be a surrogate marker for ZIKV disease and may be a potential PET imaging marker for ZIKV-induced neuroinflammation. Future TSPO-PET/SPECT studies on viral neuroinflammation and related encephalitis should assess the contribution of immune cells on TSPO expression and employ appropriate image correction methods to subtract blood pool activity.

Keywords: Neuroinflammation; PET; TSPO; Translocator protein; Zika.


Conflict of interest statement

The authors declare no competing interests.

Figures
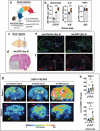
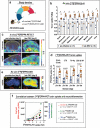
Fig. 1
Fig. 1
In vitro detection of neuroinflammation in ZIKV-infected mice. (a) Study timeline and experimental procedures performed on the acute Zika virus (ZIKV) mouse infection model. (b–f) Assays to detect neuroinflammation on day 0 (pre-infection), day 4 (mid disease), and day 8 (late disease). (b) Viral load and expression of pro-inflammatory cytokines (IL-6 and TNF-α) in whole brains harvested at stages of increasing severity of ZIKV disease. Samples were obtained from n = 8 mice at each disease stage. Data are presented as mean ± SD, and each point represents one mouse. Mean viral titres were compared by Kruskal–Wallis test with Dunn’s post-hoc correction; and cytokine expression was compared by Mann–Whitney test. (c) Brain map depicting regions of transverse slices shown in d–g. (d) Representative image of histopathologic details of neuroinflammation in late disease brains stained with hematoxylin and eosin (H&E). The encircled area highlights infiltration of immune cells in the brain parenchyma. (e–f) Representative images of region 1 brain sections subjected to immunofluorescence (I.F.) staining for neuroinflammation markers (e) glial fibrillary acidic protein (GFAP) and (f) translocator protein (TSPO). The areas enclosed in white squares are enlarged in the insets. (g) Representative [3H]PK11195-DAR (digital autoradiography) images of transverse sections from brain regions 1 and 2 taken at various stages of increasing ZIKV disease severity. Sections obtained from n = 6 mice at each disease stage were incubated with 0.01 mM tracer for 1 h prior to imaging. (h) Quantification of radioligand bound to brain tissue sections. Data are presented as mean ± SD, and individual points represent a tissue section. Means were compared by Kruskal–Wallis test with Dunn’s post-hoc correction. p values are displayed accordingly: *p < 0.05, ***p < 0.001. ns, not significant
Fig. 2
Fig. 2
Ex vivo and in vivo detection of ZIKV-associated neuroinflammation with [18F]FEPPA. (a) Study timeline and experimental procedures performed on the acute Zika virus (ZIKV) mouse infection model. (b) Biodistribution of [18F]FEPPA in blood and various brain regions harvested at 2-h post-injection of tracer. Tissues were obtained from pre-infected (n = 5) and late ZIKV (n = 6) mice. Data are presented as mean ± SD, and each point represents data from individual mice. Means were compared by Mann–Whitney test, and p values are displayed accordingly. *p < 0.05. (c) Pre-infection and late disease head-focused [18F]FEPPA-PET/CT image slices in one animal. Representative images were taken at 2-h post-injection of tracer. Regions of interest are drawn depicting brain segmentation analysis. (d) Tracer uptake quantification in either whole brains or segmented brain regions reported as %ID (injected dose) in PET images. Mean %ID were compared by Mann–Whitney test. (e) Representative ex vivo [18F]FEPPA-DAR (digital autoradiography) images of sagittal brain sections harvested and sectioned at 2-h post-injection of tracer. (f) Correlation between brain [18F]FEPPA uptake and either tissue viral load or expression of pro-inflammatory cytokines IL-6 and TNF-α. Data points from pre-infection are shown as circles, and those from late disease are shown in squares. Analysis for Spearman correlation (ρ) was performed on scatter plots with given best-fit linear regression model (R2). The 95% confidence interval of the best-fitted regression lines are shown in correspondingly coloured dashed lines. CTX, cerebral cortex; HPF, hippocampal formation; Th + Hy, thalamus and hypothalamus (diencephalon); CBX, cerebellum; MY, medulla oblongata
Fig. 3
Fig. 3
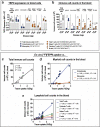
Contribution of TSPO expression on immune cells to [18F]FEPPA uptake in whole brains during ZIKV disease. (a) Study timeline and experimental procedures performed on the acute Zika virus (ZIKV) mouse infection model. (b) Translocator protein (TSPO) expression profile of various immune cell subsets in whole brains at various stages of Zika virus (ZIKV) disease. Immune cells were identified from n = 6 mice at each disease stage by flow cytometry using fluorophore-tagged antibodies for specific immune cell markers, which are shown in the legend. Data are presented as mean ± SD, and individual points represent data from individual mice. Means were compared by Kruskal–Wallis test with Dunn’s post-hoc correction. p values are displayed accordingly. *p < 0.05, **p < 0.005. (c–f) Correlation between TSPO expression of immune cells in the brain and ex vivo [18F]FEPPA uptake in whole brains determined by gamma counting. TSPO expression of either (c) total CD45+ immune cells, (d) microglia, (e) monocytes, and (f) granulocytes isolated from whole brains was determined by flow cytometry. Data points from pre-infection are shown as circles, and those from late disease are shown in squares. Analysis for Spearman correlation (ρ) was performed on scatter plots with given best-fit linear regression model (R2). The 95% confidence interval of the best-fitted regression lines is shown in dashed lines
Fig. 4
Fig. 4
Contribution of immune cell landscape to [18F]FEPPA uptake in whole brains during ZIKV disease. (a) Absolute counts of various immune cell subsets isolated from whole brains during progressive stages of Zika virus (ZIKV) disease. Immune cells were identified from n = 16 mice at each disease stage by flow cytometry using fluorophore-tagged antibodies for specific immune cell markers, which are shown in the legend. Data are presented as mean ± SD, and individual points represent data from individual mice. Means were compared by Kruskal–Wallis test with Dunn’s post-hoc correction. p values are displayed accordingly. *p < 0.05, **p < 0.005, ***p < 0.001. (b–d) Correlation between ex vivo [18F]FEPPA uptake in whole brains and immune cell counts during ZIKV disease. (b) Total immune (CD45+) cells, (c) myeloid cells, and (d) lymphoid cells were identified by flow cytometry. Data points from pre-infection are shown as circles, and those from late disease are shown in squares. Analysis for Spearman correlation (ρ) was performed on scatter plots with given best-fit linear regression model (R.2)
Fig. 5
Fig. 5
Contribution of TSPO expression on immune cells and immune cell landscape on [18F]FEPPA activity in the blood. (a) Translocator protein (TSPO) expression of various immune cells, and (b) Absolute counts of immune cells in the blood at various stages of Zika virus (ZIKV) disease. Immune cells were identified from n = 4 mice at each disease stage by flow cytometry using fluorophore-tagged antibodies for specific immune cell markers, which are shown in the legend. Data are presented as mean ± SD, and individual points represent data from individual mice. Means were compared by Mann–Whitney test. p values are displayed accordingly. *p < 0.05. (ce) Correlation between ex vivo [18F]FEPPA activity in the blood and absolute counts of immune cells. (c) Total immune CD45+ cells, (d) myeloid cells, and (e) lymphoid cell subsets were identified by flow cytometry. Analysis for Spearman correlation (ρ) was performed on scatter plots with given best-fit linear regression model (R2)

Similar articles

Cited by

References

    1. Dick GW, Kitchen SF, Haddow AJ. Zika virus. I. Isolations and serological specificity. Trans R Soc Trop Med Hyg. 1952;46:509–20. 10.1016/0035-9203(52)90042-4. - PubMed
    1. Li H, Saucedo-Cuevas L, Shresta S, Gleeson JG. The neurobiology of Zika virus. Neuron. 2016;92:949–958. doi: 10.1016/j.neuron.2016.11.031. - DOI - PubMed
    1. Duffy MR, Chen TH, Hancock WT, Powers AM, Kool JL, Lanciotti RS, et al. Zika virus outbreak on Yap Island, Federated States of Micronesia. N Engl J Med. 2009;360:2536–2543. doi: 10.1056/NEJMoa0805715. - DOI - PubMed
    1. Araujo AQ, Silva MT, Araujo AP. Zika virus-associated neurological disorders: a review. Brain. 2016;139:2122–2130. doi: 10.1093/brain/aww158. - DOI - PubMed
    1. Mecharles S, Herrmann C, Poullain P, Tran TH, Deschamps N, Mathon G, et al. Acute myelitis due to Zika virus infection. Lancet. 2016;387:1481. doi: 10.1016/S0140-6736(16)00644-9. - DOI - PubMed