Does Oxidative Stress Along with Dysbiosis Participate in the Pathogenesis of Asthma in the Obese?
- PMID: 36346545
- PMCID: PMC9925511
- DOI: 10.1007/s12013-022-01114-z
Does Oxidative Stress Along with Dysbiosis Participate in the Pathogenesis of Asthma in the Obese?
Abstract
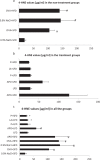
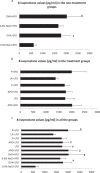
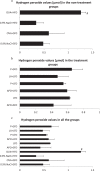
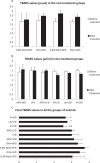
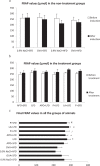
The most important environmental factor that can play a key role in the development of asthma in the obese is overproduction of reactive oxygen species (ROS). The aim of the study was to examine changes in the concentration of oxidative stress parameters in the lungs, bronchoalveolar lavage (BAL) fluid and blood of mice in models of asthma or/and obesity caused by high-fat diet (HFD). The concentrations of 4-HNE and isoprostanes in the lungs of the animals were measured. BAL fluid levels of hydrogen peroxide were marked. Additionally, thiobarbituric acid reactive substances (TBARS) and ferric reducing ability of plasma (FRAP) were used as biomarkers of oxidative stress in the blood. Administration of lipoic acid (LA), a probiotic with standard-fat diet (SFD, 10% fat) and low-fat diet (LFD, 5% fat) significantly decreased the concentration of 4-HNE as compared to the OVA (ovalbumin) + HFD group (p < 0.05). Treatment with low-fat diet or LFD in combination with apocynin insignificantly decreased H2O2 values as compared to the OVA + HFD group. Supplementation of probiotic with SFD and LFD significantly decreased the concentration of TBARS as compared to the OVA + SFD and saline + HDF groups (p < 0.05). Significantly lower concentrations of TBARS were also observed in the LA plus LFD group (p < 0.05) as compared to the OVA + HFD group. Low-fat diet with probiotic significantly increased the concentration of FRAP as compared to the obese mice (p = 0.017). Treatment with LFD in combination with LA significantly increased FRAP values as compared to the obese and obese asthmatic mice (p < 0.001).
Keywords: Biomarkers; Oxidative stress; Reactive oxygen species.
© 2022. The Author(s).
Conflict of interest statement
The authors declare no competing interests.
Figures
Similar articles
-
Alpha-lipoic acid, apocynin or probiotics influence glutathione status and selected inflammatory parameters in C57/BL6 mice when combined with a low-fat diet.Pharmacol Rep. 2023 Oct;75(5):1166-1176. doi: 10.1007/s43440-023-00527-8. Epub 2023 Sep 21. Pharmacol Rep. 2023. PMID: 37730940 Free PMC article.
-
The influence of apocynin, lipoic acid and probiotics on antioxidant enzyme levels in the pulmonary tissues of obese asthmatic mice.Life Sci. 2019 Oct 1;234:116780. doi: 10.1016/j.lfs.2019.116780. Epub 2019 Aug 17. Life Sci. 2019. PMID: 31430453
-
Ameliorative effects of α-lipoic acid on high-fat diet-induced oxidative stress and glucose uptake impairment of T cells.Free Radic Res. 2016 Oct;50(10):1106-1115. doi: 10.1080/10715762.2016.1210140. Epub 2016 Aug 4. Free Radic Res. 2016. PMID: 27383289
-
Lipoic acid attenuates high-fat-diet-induced oxidative stress and B-cell-related immune depression.Nutrition. 2012 Mar;28(3):275-80. doi: 10.1016/j.nut.2011.10.016. Nutrition. 2012. PMID: 22305006
-
alpha-Lipoic acid inhibits airway inflammation and hyperresponsiveness in a mouse model of asthma.J Allergy Clin Immunol. 2004 Aug;114(2):429-35. doi: 10.1016/j.jaci.2004.04.004. J Allergy Clin Immunol. 2004. PMID: 15316528
Cited by
-
Crosstalk between ROS-inflammatory gene expression axis in the progression of lung disorders.Naunyn Schmiedebergs Arch Pharmacol. 2024 Aug 28. doi: 10.1007/s00210-024-03392-1. Online ahead of print. Naunyn Schmiedebergs Arch Pharmacol. 2024. PMID: 39196392 Review.
-
Alpha-lipoic acid, apocynin or probiotics influence glutathione status and selected inflammatory parameters in C57/BL6 mice when combined with a low-fat diet.Pharmacol Rep. 2023 Oct;75(5):1166-1176. doi: 10.1007/s43440-023-00527-8. Epub 2023 Sep 21. Pharmacol Rep. 2023. PMID: 37730940 Free PMC article.
-
Can probiotics be used in the prevention and treatment of bronchial asthma?Pharmacol Rep. 2024 Aug;76(4):740-753. doi: 10.1007/s43440-024-00618-0. Epub 2024 Jul 1. Pharmacol Rep. 2024. PMID: 38951480 Free PMC article. Review.
-
Plumbagin alleviates obesity-related asthma: Targeting inflammation, oxidative stress, and the AMPK pathway.Immun Inflamm Dis. 2023 Sep;11(9):e1025. doi: 10.1002/iid3.1025. Immun Inflamm Dis. 2023. PMID: 37773696 Free PMC article.
-
Effects of gut microbiota on neurodegenerative diseases.Front Aging Neurosci. 2023 May 30;15:1145241. doi: 10.3389/fnagi.2023.1145241. eCollection 2023. Front Aging Neurosci. 2023. PMID: 37323141 Free PMC article. Review.
References
MeSH terms
Substances
Grants and funding
LinkOut - more resources
Full Text Sources
Medical
Miscellaneous

