. 2022 Nov 7:11:e82810.
doi: 10.7554/eLife.82810.

Contrasting effects of Ksr2, an obesity gene, on trabecular bone volume and bone marrow adiposity

Affiliations

Contrasting effects of Ksr2, an obesity gene, on trabecular bone volume and bone marrow adiposity

Gustavo A Gomez et al. Elife. .

Abstract

Pathological obesity and its complications are associated with an increased propensity for bone fractures. Humans with certain genetic polymorphisms at the kinase suppressor of ras2 (KSR2) locus develop severe early-onset obesity and type 2 diabetes. Both conditions are phenocopied in mice with Ksr2 deleted, but whether this affects bone health remains unknown. Here we studied the bones of global Ksr2 null mice and found that Ksr2 negatively regulates femoral, but not vertebral, bone mass in two genetic backgrounds, while the paralogous gene, Ksr1, was dispensable for bone homeostasis. Mechanistically, KSR2 regulates bone formation by influencing adipocyte differentiation at the expense of osteoblasts in the bone marrow. Compared with Ksr2's known role as a regulator of feeding by its function in the hypothalamus, pair-feeding and osteoblast-specific conditional deletion of Ksr2 reveals that Ksr2 can regulate bone formation autonomously. Despite the gains in appendicular bone mass observed in the absence of Ksr2, bone strength, as well as fracture healing response, remains compromised in these mice. This study highlights the interrelationship between adiposity and bone health and provides mechanistic insights into how Ksr2, an adiposity and diabetic gene, regulates bone metabolism.

Keywords: adipose tissue; genetics; genomics; mouse; mouse models; osteoporosis.

Plain language summary

Our bones are living tissues which constantly reshape and renew themselves. This ability relies on stem cells present in the marrow cavity, which can mature into the various types of cells needed to produce new bone material, marrow fat, or other components. Obesity and associated conditions such as type 2 diabetes are often linked to harmful changes in the skeleton. In particular, these metabolic conditions are associated with weight-bearing bones becoming more prone to facture and healing poorly. Mice genetically modified to model obesity and diabetes could help researchers to study exactly how these conditions – and the genetic changes that underlie them – impact bone health. Gomez et al. aimed to address this question by focusing on KSR2, a gene involved in energy consumption and feeding behavior. Children who carry certain KSR2 mutations are prone to obesity and type 2 diabetes; mice lacking the gene also develop these conditions due to uncontrolled eating. Closely examining mutant mice in which Ksr2 had been deactivated in every cell revealed that the weight-bearing bones of these animals were also more likely to break, and the fractures then healed more slowly. This was the case even though these bones had higher mass and less marrow fat compared to healthy mice. Non-weight bearing bones (such as the spine) did not exhibit these changes. Further experiments revealed that, when expressed normally in the skeleton, Ksr2 skews the stem cell maturation process towards marrow fat cells instead of bone-creating cells. This suggests a new role for Ksr2, which therefore seems to independently regulate both feeding behavior and bone health. In addition, the work by Gomez et al. demonstrate that Ksr2 mutant mice could be a useful model to better understand how obesity and diabetes affect human bones, and to potentially develop new therapies.


Conflict of interest statement

GG, CR, WX, CK, SP, RL No competing interests declared, DP was employed by Lexicon Pharmaceuticals, Inc, at the time some of these studies were performed and may own common stock or have been granted stock options, SM Reviewing editor, eLife

Figures

Figure 1.
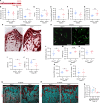
Figure 1.. Ksr2 regulates bone mass in females.
(A) Schematic of Ksr2 knocked out in the C57BL/6J-Tyrc-Brd × 129SvEvBrd hybrid strain with exon 13 deleted (X), and accompanying ventral view of genotyped mice at 4 months of age exhibiting differences in weight gain. (B) Representative 3D micro-computed tomography (microCT) reconstruction images of the secondary spongiosa at the distal femoral metaphysis in wild-type (Ksr2+/+, WT) or knockout (Ksr2-/-, KO) females at 11 and 15 weeks, revealing a prominent increase in trabecular bone in KOs. Scale bar: 100 μm. (C–H) MicroCT measurements from the trabecular bone as represented in panel (B) (n = 6–10/group), BV/TV, bone volume/tissue volume; CONN.D, connectivity density; SMI, structural model index; Tb.N, trabecular number; Tb.Th, trabecular thickness; Tb.Sp, trabecular spacing. (I) Representative 3D reconstruction of microCT images of primary spongiosa in WT or KO mice at 15 weeks of age revealing increased bone density in KO mice. Scale bar: 100 μm. (J–M) Quantification of microCT parameters measured in panel (I) (n = 6–10/group). (N) Representative 3D reconstruction of microCT images of cortical bone at the femoral mid-diaphysis (scale bar: 100 μM), where the TV total volume (O) is not affected, while BV/TV and volumetric bone mineral density (vBMD) (P, Q) are increased in KO mice. Statistics analyzed by unpaired two-tailed Student’s t-test, and graphed lines represent the mean ± SEM, *p<0.05, **p<0.005.
Figure 2.
Figure 2.. Ksr2 negatively regulates femoral bone in males, while Ksr1 deletion does not affect trabecular bone in either gender.
(A) Representative 3D micro-computed tomography (microCT) reconstruction images of the distal femoral metaphysis in wild-type (WT) or knockout (KO) male mice at 16 weeks of age revealing increased trabecular bone in KOs. Scale bar: 100 μm. (B–G) MicroCT measurements from the trabecular bone as represented in panel (A) (n = 5–9 mice per group). BV/TV, bone volume/tissue volume; CONN.D, connectivity density; SMI, structural model index; Tb.N, trabecular number; Tb.Th, trabecular thickness; Tb.Sp, trabecular spacing. (H) Representative 3D microCT reconstruction images of cortical bones at the femoral mid-diaphysis revealing that Ksr2 deletion does not affect TV total volume (I) of cortical bone in males, while BV/TV (J) and volumetric bone mineral density (vBMD) (K) are increased in Ksr2 KO mice (n = 5–6/group). Scale bar: 100 μm. (L–Q) Quantification of microCT data from the distal femoral metaphysis of WT and Ksr1 knockout mice at 16 weeks of age, showing minimal changes in trabecular bone parameters between genotypes in either gender. Statistics analyzed by two-tailed Student’s t-test, and graphed lines represent the mean ± SEM, *p<0.05, **p<0.005.
Figure 3.
Figure 3.. Ksr2 deletion in a different genetic background, histomorphometry, and histology validates that Ksr2 negatively regulates bone formation.
(A) Schematic of Ksr2 knocked out in the DBA/1LacJ strain with exon 4 deleted (X). (B) No differences were noted in body length at 8 weeks of age, while gains in body weight (C) and body fat percentage (D) are noted in knockouts (KOs). Bone mineral density (BMD) is increased in total body (E) and femurs (G) of KO mice, while femur length is not changed (F) (n = 7–12 mice/group; genders combined) (D–G reflect dual-energy X-ray absorptiometry measurements). (H) Representative alizarin red images at the distal femoral epiphysis show increased area of mineral staining in KO mice at 11 weeks of age. Scale bar: 100 μm. (I, J) Quantification of alizarin stain reveals an increase in bone area/total area (BA/TA) and a decrease in osteoid area/bone area (OA/BA). (K) Representative histomorphometric images of fluorescent calcein label reveal increased staining in KO mice. Scale bar: 100 μm. (L–N) Quantification of histomorphometric parameters measured, showing increased bone formation rate/bone surface (BFR/BS) and mineral apposition rate (MAR), yet no changes in the number of osteoclasts per bone surface (Oc.S/BS) (n = 4–7 mice/group). (O, P) Serum levels of bone formation marker (PINP) and bone resorption marker (Ctx-1) in 8-week-old female Ksr2 mutant and wild-type mice (n = 5–7 mice/group). (Q, R) Immunofluorescence staining at distal femoral metaphysis for (IBSP, synonym BSP2) or (SPP1, synonym OPN) (both red), counterstained with DAPI (cyan) reveals broader expression of both bone markers in KO mice; growth plate-osteoblast boundary positioned at the top. p.sp, primary spongiosa; ss, secondary spongiosa. Scale bar: 100 μm. (S) RT-qPCR reveals increased expression of osteoblast markers (Alpl, Bglap2, Spp1, and Sp7), while osteoclast markers (Acp5, Ctsk) remain unchanged in femurs of KO mice. Statistics analyzed by two-tailed Student’s t-test, and graphed lines represent the mean ± SEM, *p<0.05, **p<0.005.
Figure 3—figure supplement 1.
Figure 3—figure supplement 1.. Vertebral trabecular bone is not affected by Ksr2.
(A) Representative 3D micro-computed tomography (microCT) reconstruction images of lumbar vertebrae in wild-type (Ksr2+/+, WT) or knockout (Ksr2-/-, KO) mice at 8 weeks, revealing no change in trabecular bones by Ksr2 deletion. Scale bar: 100 μm. (B–F) MicroCT measurements from the trabecular bone as represented in panel (A) (n = 8–10/group), mixed genders. BV/TV, bone volume/tissue volume; Tb.N, trabecular number; Tb.Th, trabecular thickness; Tb.Sp, trabecular spacing; vBMD, volumetric bone mineral density. Statistics analyzed by unpaired two-tailed Student’s t-test, and graphed lines represent the mean ± SEM.
Figure 3—figure supplement 2.
Figure 3—figure supplement 2.. Osteoid area is regulated by Ksr2.
Representative Goldner-stained longitudinal sections of distal femoral bones used to quantify osteoid area over bone area (OA/BA) in Figure 3J. Scale bar: 100 μm.
Figure 4.
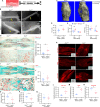
Figure 4.. Obesity in Ksr2 null mice paradoxically presents reduced bone marrow adiposity.
(A) Representative image of mice at 28 weeks of age dissected to reveal differences in visceral adipose tissue (VAT) between wild-type (WT) and Ksr2 knockouts (KOs). (B, C) RT-qPCR assessing changes in regulators of adipogenesis (B) or adipokine genes (C), in white or brown fat of Ksr2 KO mice relative to WT at 28 weeks of age (n = 3–4/group). (D) Representative 3D micro-computed tomography (microCT) reconstruction images of osmium tetroxide-labeled femurs, revealing reductions in bone marrow adipose tissue in Ksr2 KO mice at 28 weeks of age. Scale bar: 1 mm. (E) Quantification of adipocyte volume (AV) occupied by marrow adipose tissue in femurs of mice as depicted in panel (D), at proximal (prox), middle (mid), and distal (dist) thirds of the femur with position defined in reference to the spinal cord (n = 6–8/group). (F) Representative hematoxylin and eosin-stained longitudinal distal femur sections of 8-week-old mice in which adipocytes (arrows) were compared at the secondary spongiosa, revealing reductions in KO mice. Scale bar: 100 μm. (G) Quantification of sections as represented in panel (F) (n = 5–7/group). RT-qPCR comparisons in adipogenic (H) and Wnt-related (I) genes from the secondary spongiosa of femurs as shown in (F) (n = 3–5/group). Statistics analyzed by two-tailed Student’s t-test, and lines plotted reflect the mean ± SEM, *p<0.05, **p<0.005, ***p<0.0005.
Figure 5.
Figure 5.. Delayed fracture healing but increased fragility in Ksr2 knockout mice.
(A) Schematic of strategy. (B) Representative X-ray images of bones that underwent closed mid-femoral fracture in wild-type (WT) and Ksr2-/- knockout (KO) mice on the day of surgery (day 0) and day 21 post-fracture (fx). Yellow arrows point to induced fracture, while calluses are outlined by dotted yellow lines. Scale bar: 1 mm. (C) Representative 3D micro-computed tomography (microCT) reconstruction images of fracture calluses at 3 weeks post-fx. Color-coded differences in bone density are indicated in the legend. (D–F) Quantification of microCT data for total volume (TV), bone volume (BV), and BV/TV (n = 8–10/group). (G) Representative Safranin O-stained chondrocytes in WT and Ksr2-/- bones at 3 weeks post-fx showing increased cartilage in KO mice and corresponding quantification (H) (n = 6–7/group). (I) Representative TRAP-stained osteoclasts in calluses at 3 weeks post-fx., showing no difference between genotypes, with corresponding quantification of osteoclasts/bone surface within callus (H) (n = 7–8/group). All histology sections were counterstained with fast green dye. Scale bars: 1 mm at low magnification (mag), top rows; or 100 μm at high magnification, bottom rows. (K) Representative immunofluorescence images for COL10A1, IBSP, SP7/OSX of fracture callus at 3 weeks post-fx. Dashed lines within the insets delineate the callus area quantified. Scale bar: 1 mm at low-magnification insets; 100 μm at high magnification. (L–N) Quantitation of fracture callus. (O–Q) Three-point bending test shows femurs of Ksr2-/- KO mice tolerate less load to fracture with reduced stiffness, while elasticity remains unchanged. N, Newton; GPa, GigaPascal (n = 6–7/group mixed genders; two males per group). Statistics were analyzed by two-tailed Student’s t-test, and graphed lines represent the mean ± SEM, * p<0.05.
Figure 6.
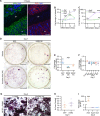
Figure 6.. KSR2 is expressed in bone, and ex vivo gain-of-function studies demonstrate Ksr2 represses osteoblast differentiation but is dispensable for osteoclast differentiation.
(A) Representative immunofluorescence for KSR2 (green) and OPN (red) expression in longitudinal sections of distal femur epiphysis from 3-week-old wild-type (WT) mice, counterstained with DAPI (blue). ep, epiphyseal bone; gp, growth plate; ss, secondary spongiosa. Scale bar: 100 μm. (B) Ex vivo time-course RT-qPCR characterization of Alpl, Ksr2, and Ksr1 mRNA expression on calvaria pre-osteoblasts isolated from WT mice following induction with osteoblast differentiation conditions relative to vehicle treatment (n = 3–4 independent experiments). (C) Ex vivo time-course RT-qPCR characterization of Acp5 and Ksr2 on primary macrophage cells isolated from femoral bones of WT mice following osteoclast differentiation relative to vehicle treatment (n = 3–4 independent experiments). (D) Representative images of alizarin red-stained primary bone marrow stromal cells with forced expression of either GFP or KSR2 after 7 days of treatment with either vehicle or ascorbic acid (AA). Scale bar: 10 mm. (E) RT-qPCR for Alpl on day 3 or (F) various osteoblast markers on day 7 (n = 4 independent experiments). (G) Representative images of multinuclear osteoclasts stained with ACP5/TRAP following 6 days of osteoclast differentiation from macrophages isolated from femurs and transduced with either GFP or KSR2. Scale bar: 100 μm (H) Quantification of multinuclear osteoclasts (Ocs) counted/well as shown in panel (G). (I) RT-qPCR for Ksr2, or osteoclast markers Acp5, Ctsk in osteoclasts on day 6 of differentiation as represented in panel (G). Statistics analyzed by two-tailed Student’s t-test, and graphed lines represent the mean ± SEM, *p<0.05, **p<0.005, ***p<0.0005.
Figure 7.
Figure 7.. Ksr2 regulates femoral trabecular bone autonomously.
(A–C) Pair-feeding experiments reveal that gains in mineral density are acquired independently of eating-induced weight gains in knockout (KO) mice fed at will (Ad lib) or pair-fed according to the amount eaten by wild-type (WT) mice. Panels (A–C) are represented as a percentage relative to WT. BW, body weight; Fe BMD, femur bone mineral density; BV/TV, bone volume/total volume (n = 3–6/group). (D) BV/TV from femoral metaphysis of WT and KO at end of pair-feeding. (E) Conditional knockout strategy. (F–H) Differences between control (Ksr2fl/+) and conditional knockout, cKO (Ksr2fl/fl), mice in percent body fat (F), body weight (G), and femur bone mineral density (H) (n = 3–4/group). (Note: B, C, G, H reflect dual-energy X-ray absorptiometry measurements.) (I) Representative 3D micro-computed tomography (microCT) reconstruction images of distal femoral metaphysis in control and cKO mice at 12 weeks of age, revealing increased trabecular bone in cKO mice. Scale bar: 100 μm. (J–O) MicroCT measurements from the trabecular bone as represented in panel (I) (n = 7 mice per group; mixed genders). CONN.D, connectivity density; SMI, structural model index; Tb.N, trabecular number; Tb.Th, trabecular thickness; Tb.Sp, trabecular spacing. Statistics were analyzed by two-tailed Student’s t-test, and graphed lines represent the mean ± SEM, *p<0.05, **p<0.005 for comparisons between groups labeled on the x-axis. In panels (A–C), significance between Ksr2 KO and WT for a given condition is represented by #p<0.05 or ##p<0.005.
Figure 8.
Figure 8.. KSR2 promotes osteoblast differentiation through mTOR signaling affecting Hif1a and Vegfa, but not Notch signaling in the process.
(A) RT-qPCR for Alp from ST2 stromal cells overexpressing KSR2 or GFP by lentivirus (LV) on day 3 in normal glucose (NG) or high glucose (HG) without (-) or with (+) insulin. (B) Western blot for ST2 cells overexpressing GFP or KSR2 after 30 min in vehicle control, 100 μg/ml Insulin, or 100 ng/ml IGF-1, for the mTOR response target phosphorylated p-RPS6, total RPS6, or loading control, β-actin; 1,2,3 indicate biological replicates. (C) Quantification of WB comparing p-RPS6/RPS6 ratios. Within-group (*), between-group (#) comparisons (n = 3/group). (D) Representative image of ALP activity for ST2 stromal cells in osteoblast differentiation conditions on day 7 treated with vehicle (top row) or 10 nM rapamycin (bottom row). Scale bar: 10 mm. (E) RT-qPCR quantification of ST2 cells transduced with empty vector control (Con) or Ksr2 shRNA and treated with either vehicle or 10 nM rapamycin following 48 hr of osteoblast differentiation (n = 4/group). (F, G) RT-qPCR from ST2 stromal cells with KSR2 overexpression following 72 hr of osteoblast differentiation, plotted as a function of level detected in GFP controls (n = 4/group). (H) RT-qPCR on genes related with hypoxia or Notch signaling on RNA extracted from whole femurs of 12-week-old wild-type (WT) or Ksr2 knockout (KO) mice. Values represent fold change for KO relative to WT (set to 1, dashed line). (I) Model diagram summarizing results where high levels of KSR2 lead to low levels of mTOR activity, resulting in low bone density, while the absence of KSR2 results in high levels of mTOR activity, resulting in high bone density. All statistics analyzed by two-tailed Student’s t-test, graphed lines represent mean ± SEM. #p<0.05, *p<0.05, **p<0.005, $p<10–6.

Similar articles

Cited by

References

    1. Aaron N, Kraakman MJ, Zhou Q, Liu Q, Costa S, Yang J, Liu L, Yu L, Wang L, He Y, Fan L, Hirakawa H, Ding L, Lo J, Wang W, Zhao B, Guo E, Sun L, Rosen CJ, Qiang L. Adipsin promotes bone marrow adiposity by priming mesenchymal stem cells. eLife. 2021;10:e69209. doi: 10.7554/eLife.69209. - DOI - PMC - PubMed
    1. Abe I, Ochi K, Takashi Y, Yamao Y, Ohishi H, Fujii H, Minezaki M, Sugimoto K, Kudo T, Abe M, Ohnishi Y, Mukoubara S, Kobayashi K. Effect of denosumab, a human monoclonal antibody of receptor activator of nuclear factor kappa-B ligand (RANKL), upon glycemic and metabolic parameters: effect of denosumab on glycemic parameters. Medicine. 2019;98:e18067. doi: 10.1097/MD.0000000000018067. - DOI - PMC - PubMed
    1. Ackert-Bicknell CL, Shockley KR, Horton LG, Lecka-Czernik B, Churchill GA, Rosen CJ. Strain-specific effects of rosiglitazone on bone mass, body composition, and serum insulin-like growth factor-I. Endocrinology. 2009;150:1330–1340. doi: 10.1210/en.2008-0936. - DOI - PMC - PubMed
    1. Ahn JD, Dubern B, Lubrano-Berthelier C, Clement K, Karsenty G. Cart overexpression is the only identifiable cause of high bone mass in melanocortin 4 receptor deficiency. Endocrinology. 2006;147:3196–3202. doi: 10.1210/en.2006-0281. - DOI - PubMed
    1. Astudillo P, Ríos S, Pastenes L, Pino AM, Rodríguez JP. Increased adipogenesis of osteoporotic human-mesenchymal stem cells (mscs) characterizes by impaired leptin action. Journal of Cellular Biochemistry. 2008;103:1054–1065. doi: 10.1002/jcb.21516. - DOI - PubMed

Publication types

Substances