. 2023 Jan 2;220(1):e20220258.
doi: 10.1084/jem.20220258. Epub 2022 Nov 7.

Human type I IFN deficiency does not impair B cell response to SARS-CoV-2 mRNA vaccination

Affiliations

Human type I IFN deficiency does not impair B cell response to SARS-CoV-2 mRNA vaccination

Aurélien Sokal et al. J Exp Med. .

Abstract

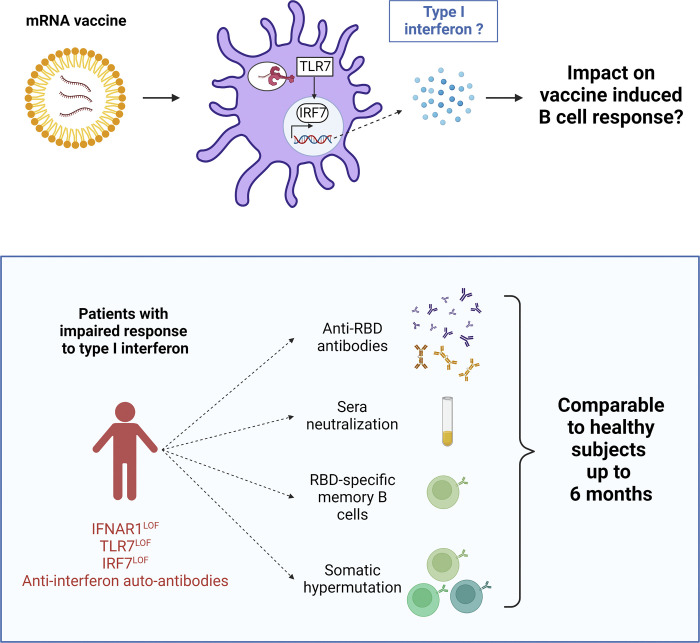
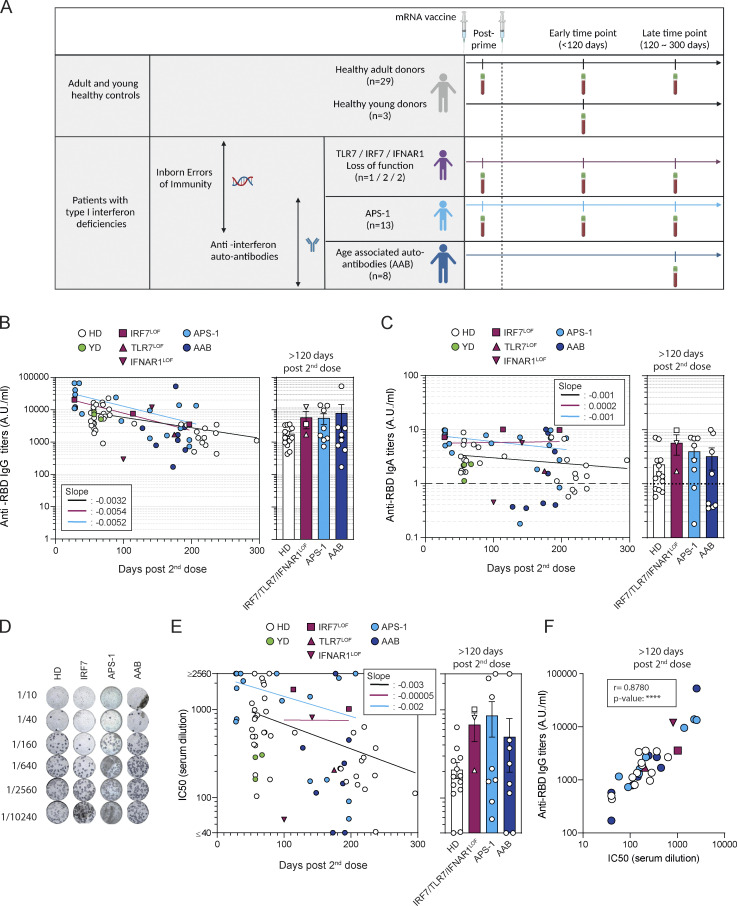
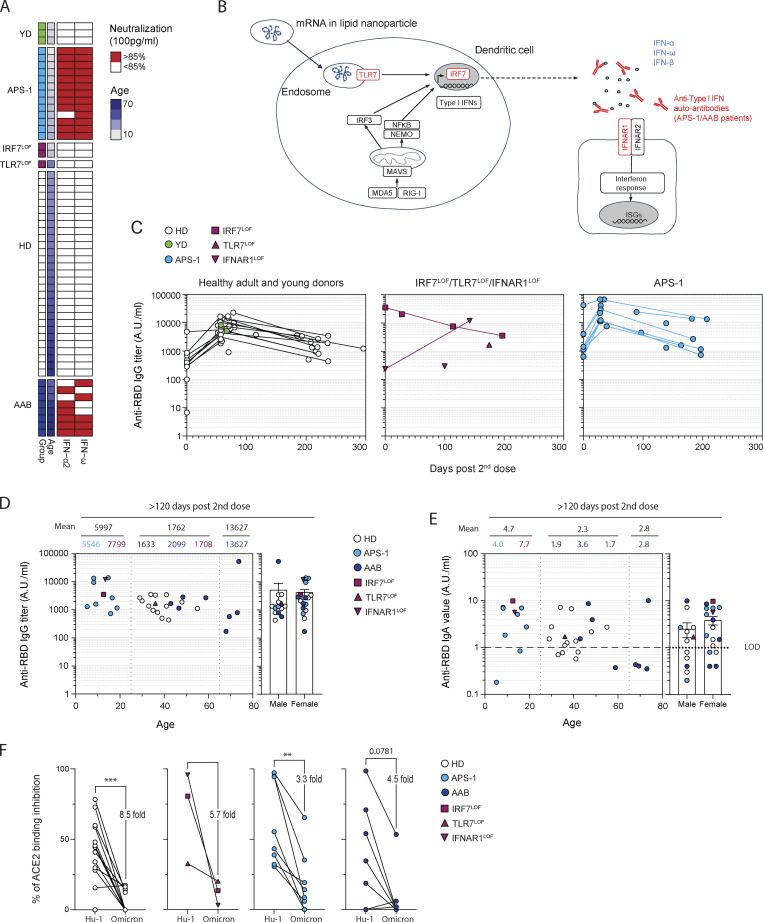
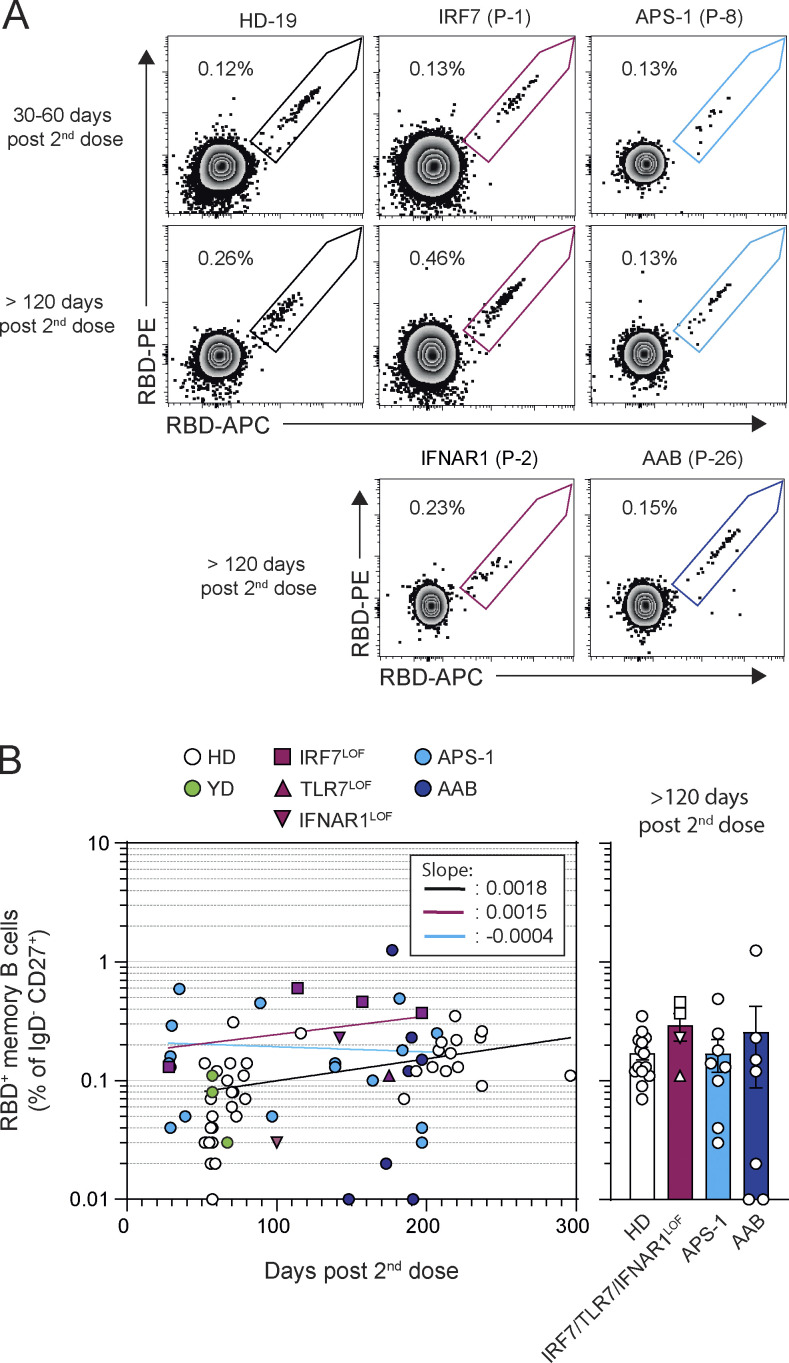
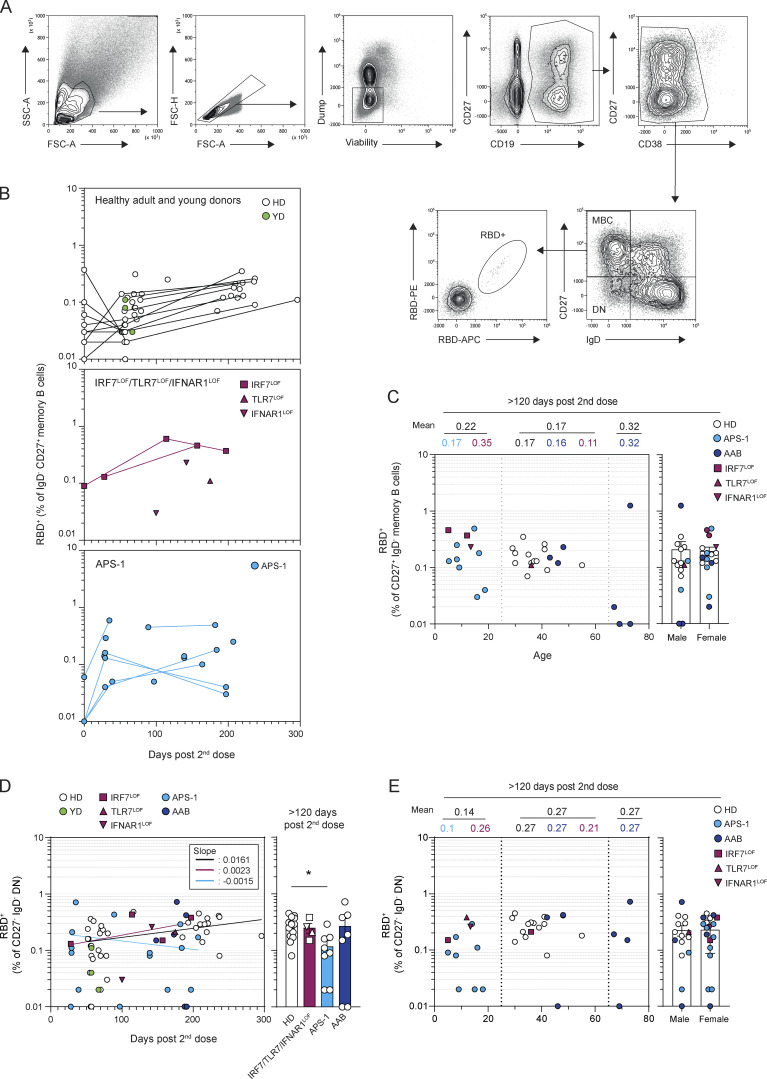
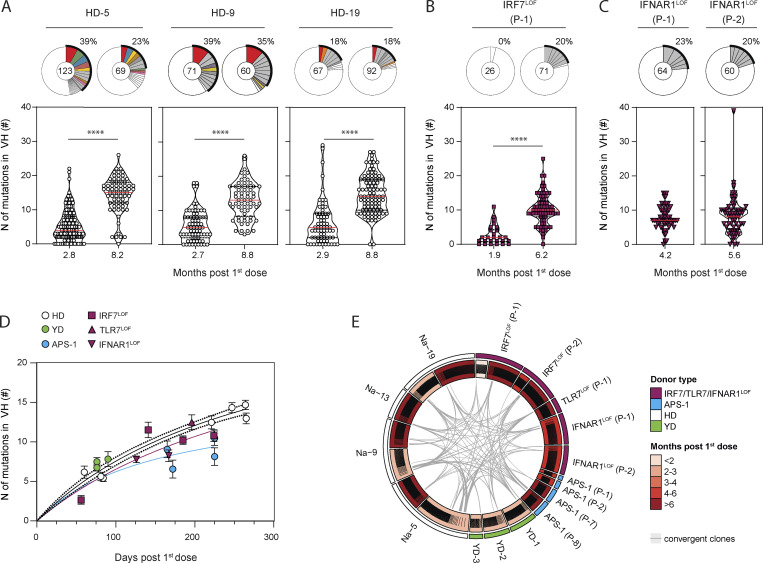
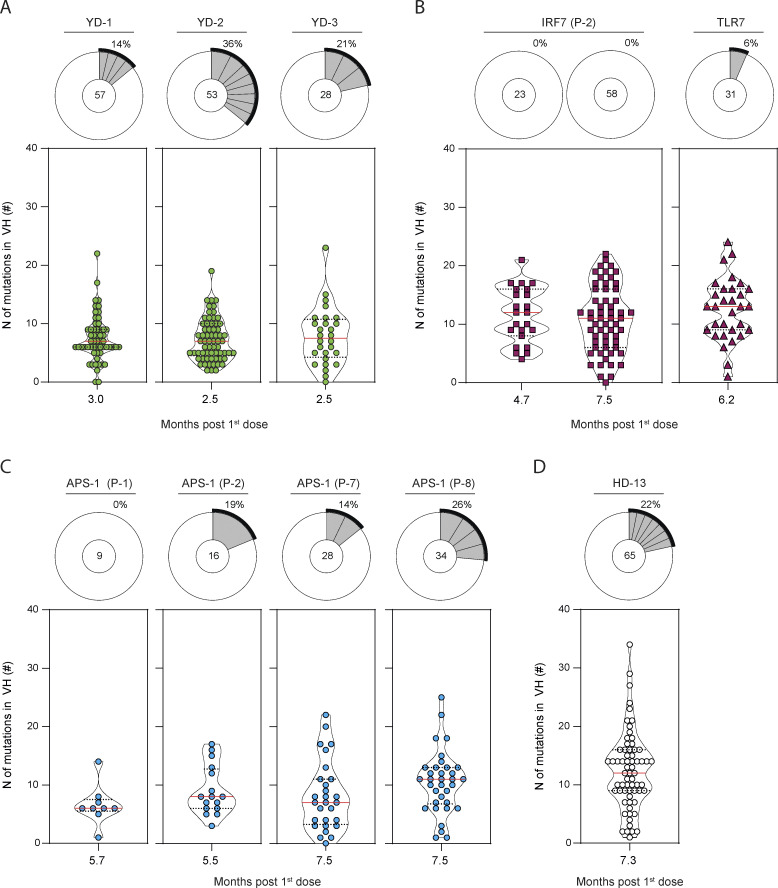
Inborn and acquired deficits of type I interferon (IFN) immunity predispose to life-threatening COVID-19 pneumonia. We longitudinally profiled the B cell response to mRNA vaccination in SARS-CoV-2 naive patients with inherited TLR7, IRF7, or IFNAR1 deficiency, as well as young patients with autoantibodies neutralizing type I IFNs due to autoimmune polyendocrine syndrome type-1 (APS-1) and older individuals with age-associated autoantibodies to type I IFNs. The receptor-binding domain spike protein (RBD)-specific memory B cell response in all patients was quantitatively and qualitatively similar to healthy donors. Sustained germinal center responses led to accumulation of somatic hypermutations in immunoglobulin heavy chain genes. The amplitude and duration of, and viral neutralization by, RBD-specific IgG serological response were also largely unaffected by TLR7, IRF7, or IFNAR1 deficiencies up to 7 mo after vaccination in all patients. These results suggest that induction of type I IFN is not required for efficient generation of a humoral response against SARS-CoV-2 by mRNA vaccines.

Trial registration: ClinicalTrials.gov NCT04402892.


Conflict of interest statement

Disclosures: S. Fourati reported personal fees from GSK, Cepheid, and Abbott outside the submitted work. I. Meyts reported grants from CSL Behring outside the submitted work. J.-C. Weill received consulting fees from Institut Mérieux. J.-L. Casanova is an inventor on patent application PCT/US2021/042741, filed July 22, 2021, submitted by The Rockefeller University that covers diagnosis of susceptibility to, and treatment of, viral disease and viral vaccines, including COVID-19 and vaccine-associated diseases. M. Mahévas reported grants from GSK and personal fees from Novartis, LFB, and Amgen outside the submitted work. No other disclosures were reported.

Figures

None
Graphical abstract
Figure 1.
Figure 1.
mRNA vaccines induce robust humoral responses in patients with type I IFN deficiency. (A) Overview of the study. (B) Evolution of anti–SARS-CoV-2 RBD serum IgG titers after mRNA vaccination. IgG titers (arbitrary units, A.U./ml) are shown according to the time of sampling (d from the second dose) for each patient (left panel) and are then compared between groups at late time point (>120 d, right panel): healthy controls (n = 33 including HD, white circle, n = 29, and YD, green circle), IRF7LOF or TLR7LOF or IFNAR1LOF (purple; IRF7LOF: square, n = 2; TLR7LOF: up triangle, n = 1; IFNAR1LOF down triangle, n = 2), APS-1 (light blue circle, n = 13), and AAB (dark blue circles, n = 8). Late time point was performed at mean 221 d, (range 193–296) for HD at 157 and 197 d for the 2 IRF7LOF patients, 175 d for the TLR7LOF patient, and 142 d for the IFNAR1LOF patient, for APS-1 patients at mean 176 d (range 139–207 d) and for AAB mean 180 d, (range 128–211 d). See Table S1 A. Bars indicate mean ± SEM. (C) Evolution of anti–SARS-CoV-2 RBD serum IgA titers after mRNA vaccination. IgA titers (A.U./ml) are shown according to the time of sampling (days) for each patient (left panel) and are then compared between groups at late time point (>120 d, right panel) Dotted line indicates positivity threshold. (D) Representative wells for the in vitro neutralization assay of sera against D614G SARS-CoV-2 virus for one patient from each cohort. Dark blue spots represent SARS-CoV-2 infected cells. Top-to-bottom wells show increasing serum dilution (dilution is indicated on the left). (E and F) Absence of foci indicate virus neutralization. (E) Evolution of IC50 against D614G SARS-CoV-2 after mRNA vaccination of sera tested from HD (n = 31), IRF7LOF/TlR7LOF/IFNAR1LOF (n = 3), APS-1 (n = 13), and AAB (n = 8). IC50 (1/dilution) are shown according to the time of sampling (days) for each patient (left panel) and are then compared between groups at late time point (>120 d, right panel). (F) Correlation between the anti–SARS-CoV-2 RBD IgG titers at late time point and neutralization potency of the sera at late time point. We performed nonlinear regression in B, C, and E (left panels; semilog line, x is linear, y is log), slopes of the lines are indicated in the boxes; and Kruskal–Wallis with multiple comparisons with Dunn’s Correction in B, C, and E (right panels). All were nonsignificant (P > 0.05). In F, Spearman correlation was performed. P value <0.0001.
Figure S1.
Figure S1.
mRNA vaccines induce robust humoral response in patients with type I IFN deficiency. (A) Heatmap showing the neutralization potency of the patients’ sera against IFN-α-2 and -ω at 100 pg/ml. Each line represents one patient. First column indicates patient group (healthy controls are in green [YD] or white [HD], APS-1 patients are in light blue, patient with IRF7LOF or TLR7LOF in purple, and patient with AAB in dark blue), second line indicates age, and the two last columns indicate sera neutralization. Sera above the positivity threshold (>85%) are depicted in red. Sera below the positivity threshold are depicted in white. (B) Schematic representation of type I IFN response theoretically triggered by mRNA vaccines. Steps that are impaired in one of the studied cohorts are indicated in red. NEMO, NF-κB essential modulator; MAVS, mitochondrial antiviral signaling protein; ISG, IFN stimulated genes. (C) Longitudinal evolution of anti–SARS-CoV-2 RBD serum IgG titers (A.U./ml) after mRNA vaccination in patients from each cohort according to the day of sampling. Day 0 represents IgG titers after the prime and before the second dose. (D) Anti RBD IgG titers (A.U./ml) at late time point (>120 d) according to the age (left panel) or sex (right panel) of the patient. Numbers on the top of the left panel indicate the mean for age group (0–25; 25–65; >65 yr old) and above number indicate the mean for each cohort in each age group. (E) Anti RBD IgA titers (A.U./ml) at late time point (>120 d) according to the age (left panel) or sex (right panel) of the patient. Numbers on the top of the left panel indicate the mean for age group (0–25; 25–65; >65 yr-old) and above number indicate the mean for each cohort in each age group. LOD, limit of detection. (F) Percentage of ACE2 binding inhibition using competitive ELISA with the sera from the patient at late time point against the ancestral Hu-1 RBD or the Omicron BA.1 RBD. Mean decrease in percentage of inhibition is indicated on the figure. We performed Mann–Whitney in D and E, and Wilcoxon test in F (***P < 0.001, **P < 0.01).
Figure 2.
Figure 2.
Circulating MBCs are detected up to 6 mo after mRNA vaccination of patients with type I IFN deficiency. (A) Representative dot plot of SARS-CoV-2 RBD-staining of CD19+IgDCD27+CD38int/ MBCs 30–60 d and >120 d after the second dose in patients representative of each cohort. (B) Evolution of percentage of RBD-specific MBCs among CD27+IgDMBCs after mRNA vaccination. Frequencies of RBD-specific MBCs are shown according to the time of sampling (days) for each patient (left panel) and are then compared between groups at late time point (>120 d, right panel). Bars indicate mean ± SEM. We performed nonlinear regression in B (semilog line, x is linear, y is log); slopes of the lines are indicated in the box (left panel). Kruskal–Wallis with multiple comparisons with Dunn’s Correction, all nonsignificant (P > 0.05, right panel).
Figure S2.
Figure S2.
Circulating MBCs are detected up to 6 mo after mRNA vaccination of patients with type I IFN deficiency. (A) Flow cytometric gating strategy for the analysis and sorting of SARS-CoV-2 S or RBD-specific MBCs from PBMCs. Lymphocytes were first gated based on morphology, before exclusion of doublets, dead cells, and CD3/CD14 cells. Total CD19+ cells were then gated and subdivided into CD38int/− cells and CD27+CD38hi plasma cells. CD38int/− B cells were further divided in four quadrants using CD27 and IgD staining. Upper left quadrant defines MBCs, lower left quadrant DN, upper right quadrant CD27+IgD+ cells, and lower right quadrant naive B cells. SARS-Cov-2 RBD-specific B cells were then analyzed within the B cell population of interest using a His-tagged SARS-Cov-2 RBD protein further revealed by two fluorescently labeled anti-His antibodies. (B) Longitudinal evolution of the RBD-specific CD27+IgD MBC (% of CD27+IgD MBCs) in patients from in each cohort. (C) Percentage of RBD-specific MBCs at late time point (>120 d) according to the age (left panel) or sex (right panel) of the patient. Numbers on the top of the left panel indicate the mean for age group (0–25; 25–65; >65 yr old) and above numbers indicate the mean for each cohort in each age group. (D) Evolution of percentage of RBD-specific DN among CD27IgDDNs after mRNA vaccination. Frequencies of RBD-specific DNs are shown according to the time of sampling (days) for each patient (left panel) and are then compared between groups at late time point (>120 d, right panel). Bars indicate mean ± SEM. (E) Percentage of RBD-specific DNs at late time point (>120 d) according to the age (left panel) or sex (right panel) of the patient. Numbers on the top of the left panel indicate the mean for age group (0–25; 25–65; >65 yr old) and above numbers indicate the mean for each cohort in each age group. We performed Mann–Whitney in B, C, and E and nonlinear regression in D (semilog line, x is linear, y is log); slopes of the lines are indicated in the box (left panels). Kruskal–Wallis with multiple comparisons with Dunn’s Correction (right panel). *P < 0.05.
Figure 3.
Figure 3.
RBD-specific MBCs are GC derived in patients with type I IFN deficiency. (A–C) Violin plot showing the number of mutations in the IgVH of RBD-specific MBCs from (A) HD, (B) IRF7LOF, and (C) IFNAR1LOF subjects. All subjects received two doses of mRNA vaccine. Time point of analysis is however indicated here from the first dose (months), as it represents the first antigen encounter. Each box is a single patient. The pie chart at the top of each plot represents the clonal distribution of RBD-specific MBCs at indicated time points. Colored slices indicate an expanded MBC clone found at several time points from the same donor, gray slices indicate an expanded clone not found at another time point from the same donor, and white slices indicate unique sequences but found at another time point from the same donor. Outer black semicircular line indicates the proportion of sequences belonging to expanded clones. The total number of sequences is indicated at the pie center. (D) Mean (± SEM) number of mutations in IgVH of RBD-specific MBCs for each analyzed patient at a given time point, plotted according to the time of sampling after the first dose. (E) Circos plot showing clonal relationships between RBD-specific MBCs from HD (white outer line for HD, green outer line for YD) and patient with impaired IFN signaling (purple for IRF7LOF, TLR7LOF, and IFNAR1LOF, light blue for APS-1) at indicated time point. Inner line indicates clone distribution for each patient and is colored according to the time of sampling. Gray lines indicate public clones shared between patients. We performed Mann–Whitney in A–C (****P < 0.0001) and nonlinear regression with Michaelis–Menten model in D.
Figure S3.
Figure S3.
RBD-specific MBCs are GC derived in patients with type I IFN deficiency. (A–D) Violin plot showing the number of mutations in the IgVH of RBD-specific MBCs at indicated time point after first dose (months) for YDs (A), IRF7LOF (B), APS-1 (C), and HD (D). Pie chart at the top of each plot represents the clonal distribution of RBD-specific MBCs at indicated time point. Gray slices indicate expanded clones. Outer black semi-circular line indicates the proportion of sequences belonging to expanded clones. The total number of sequences is indicated at the pie center. We performed Mann–Whitney in B (left).

Similar articles

Cited by

References

    1. Alameh, M.-G., Tombácz I., Bettini E., Lederer K., Sittplangkoon C., Wilmore J.R., Gaudette B.T., Soliman O.Y., Pine M., Hicks P., et al. . 2021. Lipid nanoparticles enhance the efficacy of mRNA and protein subunit vaccines by inducing robust T follicular helper cell and humoral responses. Immunity. 54:2877–2892.e7. 10.1016/j.immuni.2021.11.001 - DOI - PMC - PubMed
    1. Ali, K., Berman G., Zhou H., Deng W., Faughnan V., Coronado-Voges M., Ding B., Dooley J., Girard B., Hillebrand W., et al. . 2021. Evaluation of mRNA-1273 SARS-CoV-2 vaccine in adolescents. N. Engl. J. Med. 385:2241–2251. 10.1056/NEJMoa2109522 - DOI - PMC - PubMed
    1. Anderson, B.R., Muramatsu H., Nallagatla S.R., Bevilacqua P.C., Sansing L.H., Weissman D., and Karikó K.. 2010. Incorporation of pseudouridine into mRNA enhances translation by diminishing PKR activation. Nucleic Acids Res. 38:5884–5892. 10.1093/nar/gkq347 - DOI - PMC - PubMed
    1. Asano, T., Boisson B., Onodi F., Matuozzo D., Moncada-Velez M., Maglorius Renkilaraj M.R.L., Zhang P., Meertens L., Bolze A., Materna M., et al. . 2021. X-linked recessive TLR7 deficiency in ∼1% of men under 60 years old with life-threatening COVID-19. Sci. Immunol. 6:eabl4348. 10.1126/sciimmunol.abl4348 - DOI - PMC - PubMed
    1. Baden, L.R., El Sahly H.M., Essink B., Kotloff K., Frey S., Novak R., Diemert D., Spector S.A., Rouphael N., Creech C.B., et al. . 2021. Efficacy and safety of the mRNA-1273 SARS-CoV-2 vaccine. N. Engl. J. Med. 10.1056/NEJMoa2035389 - DOI - PMC - PubMed

Publication types

Associated data