Multi-spectral immunofluorescence evaluation of the myeloid, T cell, and natural killer cell tumor immune microenvironment in chordoma may guide immunotherapeutic strategies
- PMID: 36338744
- PMCID: PMC9634172
- DOI: 10.3389/fonc.2022.1012058
Multi-spectral immunofluorescence evaluation of the myeloid, T cell, and natural killer cell tumor immune microenvironment in chordoma may guide immunotherapeutic strategies
Abstract
Background: Chordoma is a rare, invasive, and devastating bone malignancy of residual notochord tissue that arises at the skull base, sacrum, or spine. In order to maximize immunotherapeutic approaches as a potential treatment strategy in chordoma it is important to fully characterize the tumor immune microenvironment (TIME). Multispectral immunofluorescence (MIF) allows for comprehensive evaluation of tumor compartments, molecular co-expression, and immune cell spatial relationships. Here we implement MIF to define the myeloid, T cell, and natural killer (NK) cell compartments in an effort to guide rational design of immunotherapeutic strategies for chordoma.
Methods: Chordoma tumor tissue from 57 patients was evaluated using MIF. Three panels were validated to assess myeloid cell, T cell, and NK cell populations. Slides were stained using an automated system and HALO software objective analysis was utilized for quantitative immune cell density and spatial comparisons between tumor and stroma compartments.
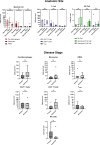
Results: Chordoma TIME analysis revealed macrophage infiltration of the tumor parenchyma at a significantly higher density than stroma. In contrast, helper T cells, cytotoxic T cells, and T regulatory cells were significantly more abundant in stroma versus tumor. T cell compartment infiltration more commonly demonstrated a tumor parenchymal exclusion pattern, most markedly among cytotoxic T cells. NK cells were sparsely found within the chordoma TIME and few were in an activated state. No immune composition differences were seen in chordomas originating from diverse anatomic sites or between those resected at primary versus advanced disease stage.
Conclusion: This is the first comprehensive evaluation of the chordoma TIME including myeloid, T cell, and NK cell appraisal using MIF. Our findings demonstrate that myeloid cells significantly infiltrate chordoma tumor parenchyma while T cells tend to be tumor parenchymal excluded with high stromal infiltration. On average, myeloid cells are found nearer to target tumor cells than T cells, potentially resulting in restriction of T effector cell function. This study suggests that future immunotherapy combinations for chordoma should be aimed at decreasing myeloid cell suppressive function while enhancing cytotoxic T cell and NK cell killing.
Keywords: T cells; chordoma; immunotherapy; myeloid cells; natural killer cells; tumor immune microenvironment (TIME).
Copyright © 2022 Lopez, Robbins, Kowalczyk, Lassoued, Gulley, Miettinen, Gallia, Allen, Hodge and London.
Conflict of interest statement
NL receives research funding from Merck Sharp & Dohme, LLC regarding HPV related sinonasal carcinomas, holds stock in Navigen Pharmaceuticals and was a consultant for Cooltech Inc., none of which are relevant to the present manuscript. The remaining authors declare that the research was conducted in the absence of any commercial or financial relationships that could be construed as a potential conflict of interest.
Figures


Similar articles
-
Chordoma cancer stem cell subpopulation characterization may guide targeted immunotherapy approaches to reduce disease recurrence.Front Oncol. 2024 Apr 29;14:1376622. doi: 10.3389/fonc.2024.1376622. eCollection 2024. Front Oncol. 2024. PMID: 38741774 Free PMC article.
-
Multimodal profiling of chordoma immunity reveals distinct immune contextures.J Immunother Cancer. 2024 Jan 25;12(1):e008138. doi: 10.1136/jitc-2023-008138. J Immunother Cancer. 2024. PMID: 38272563 Free PMC article.
-
Unravelling the role of immune cells and FN1 in the recurrence and therapeutic process of skull base chordoma.Clin Transl Med. 2023 Oct;13(10):e1429. doi: 10.1002/ctm2.1429. Clin Transl Med. 2023. PMID: 37784253 Free PMC article.
-
Cytokines Orchestrating the Natural Killer-Myeloid Cell Crosstalk in the Tumor Microenvironment: Implications for Natural Killer Cell-Based Cancer Immunotherapy.Front Immunol. 2021 Jan 29;11:621225. doi: 10.3389/fimmu.2020.621225. eCollection 2020. Front Immunol. 2021. PMID: 33584718 Free PMC article. Review.
-
Clinically feasible approaches to potentiating cancer cell-based immunotherapies.Hum Vaccin Immunother. 2015;11(4):851-69. doi: 10.1080/21645515.2015.1009814. Hum Vaccin Immunother. 2015. PMID: 25933181 Free PMC article. Review.
Cited by
-
Intratumoral CD103+ CD8+ T cells predict response to neoadjuvant chemoimmunotherapy in advanced head and neck squamous cell carcinoma.Cancer Commun (Lond). 2023 Oct;43(10):1143-1163. doi: 10.1002/cac2.12480. Epub 2023 Sep 1. Cancer Commun (Lond). 2023. PMID: 37658605 Free PMC article.
-
Animal model considerations for chordoma research: reproducing the tumor microenvironment in vivo with humanized mice.Front Oncol. 2024 Mar 13;14:1330254. doi: 10.3389/fonc.2024.1330254. eCollection 2024. Front Oncol. 2024. PMID: 38544830 Free PMC article. Review.
-
Chordoma cancer stem cell subpopulation characterization may guide targeted immunotherapy approaches to reduce disease recurrence.Front Oncol. 2024 Apr 29;14:1376622. doi: 10.3389/fonc.2024.1376622. eCollection 2024. Front Oncol. 2024. PMID: 38741774 Free PMC article.
-
Multimodal profiling of chordoma immunity reveals distinct immune contextures.J Immunother Cancer. 2024 Jan 25;12(1):e008138. doi: 10.1136/jitc-2023-008138. J Immunother Cancer. 2024. PMID: 38272563 Free PMC article.
-
Immune microenvironment and immunotherapy for chordoma.Front Oncol. 2024 Jun 24;14:1374249. doi: 10.3389/fonc.2024.1374249. eCollection 2024. Front Oncol. 2024. PMID: 38983929 Free PMC article. Review.
References
LinkOut - more resources
Full Text Sources
Miscellaneous

