. 2022 Nov 5;13(1):6679.
doi: 10.1038/s41467-022-34276-8.

Hi-TrAC reveals division of labor of transcription factors in organizing chromatin loops

Affiliations

Hi-TrAC reveals division of labor of transcription factors in organizing chromatin loops

Shuai Liu et al. Nat Commun. .

Abstract

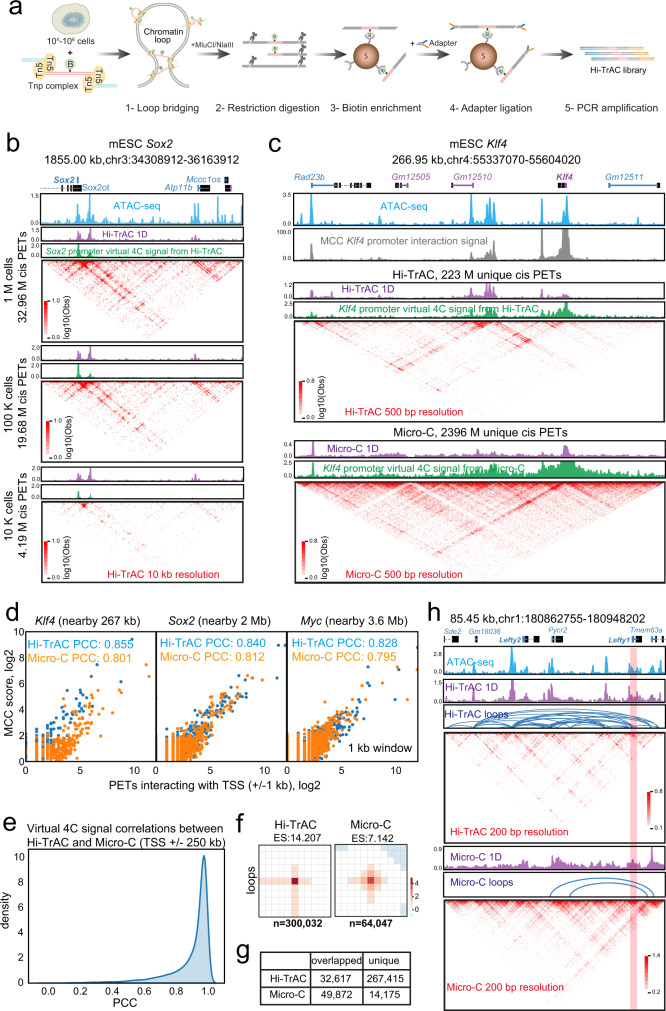
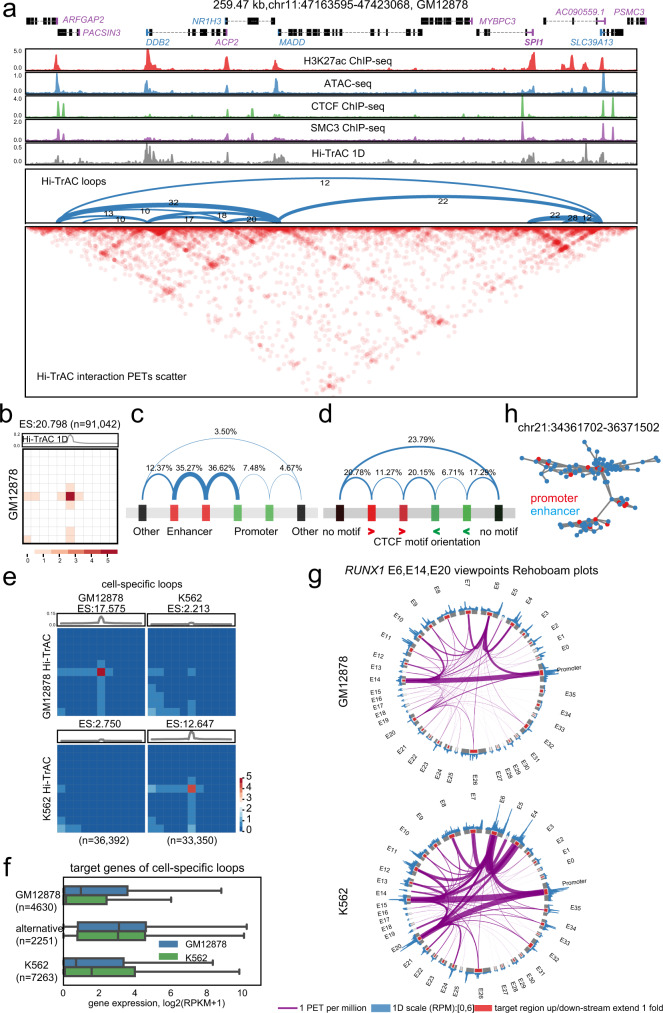
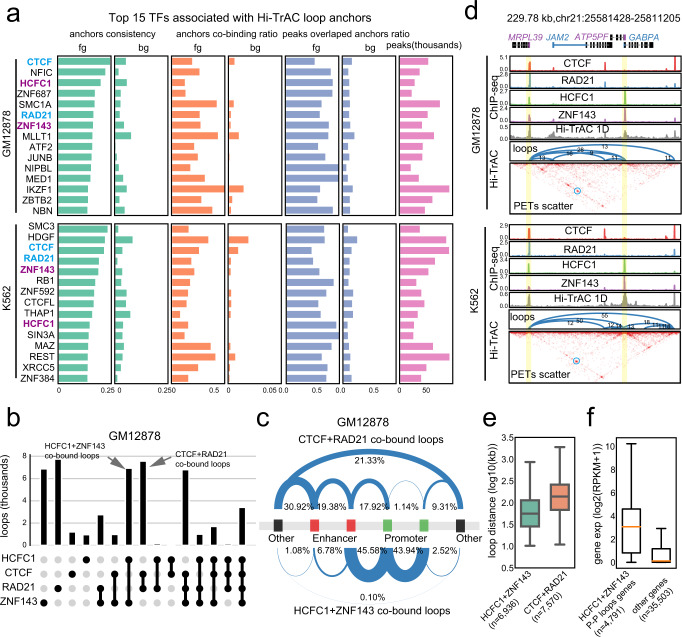
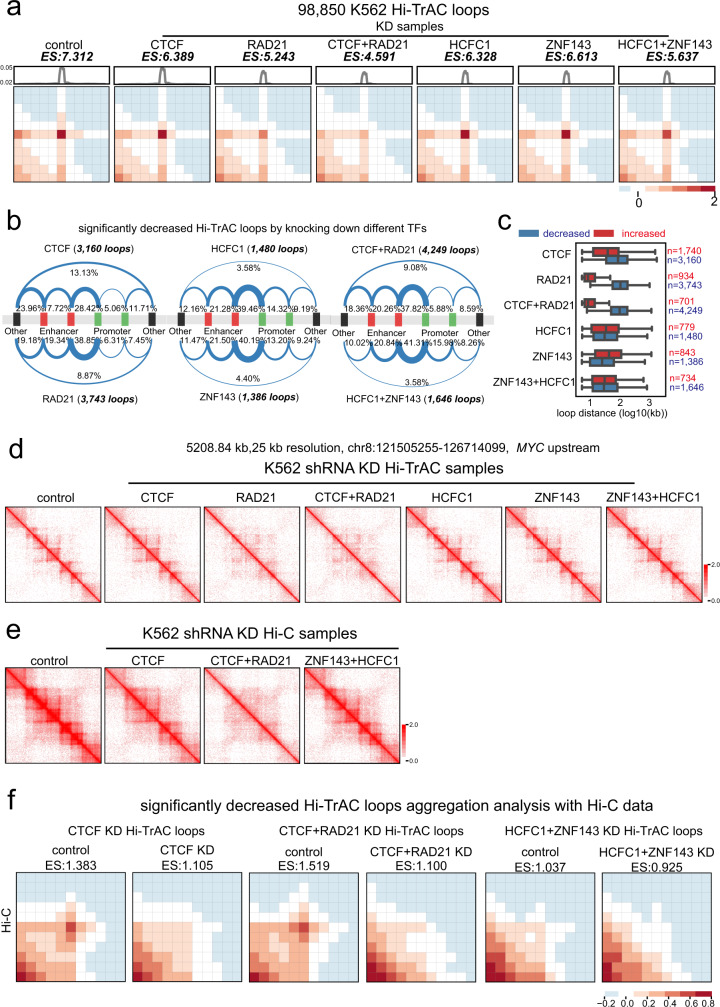
The three-dimensional genomic structure plays a critical role in gene expression, cellular differentiation, and pathological conditions. It is pivotal to elucidate fine-scale chromatin architectures, especially interactions of regulatory elements, to understand the temporospatial regulation of gene expression. In this study, we report Hi-TrAC as a proximity ligation-free, robust, and sensitive technique to profile genome-wide chromatin interactions at high-resolution among regulatory elements. Hi-TrAC detects chromatin looping among accessible regions at single nucleosome resolution. With almost half-million identified loops, we reveal a comprehensive interaction network of regulatory elements across the genome. After integrating chromatin binding profiles of transcription factors, we discover that cohesin complex and CTCF are responsible for organizing long-range chromatin loops, related to domain formation; whereas ZNF143 and HCFC1 are involved in structuring short-range chromatin loops between regulatory elements, which directly regulate gene expression. Thus, we introduce a methodology to identify a delicate and comprehensive network of cis-regulatory elements, revealing the complexity and a division of labor of transcription factors in organizing chromatin loops for genome organization and gene expression.


Conflict of interest statement

The authors declare no competing interests.

Figures

Fig. 1
Fig. 1. Mapping genome-wide regulatory interactions at high resolution by Hi-TrAC.
a Experimental scheme of Hi-TrAC. Following bridging chromatin loops using the Tnp-biotinylated bivalent ME linker complex in formaldehyde fixed cells, the DNA is cleaved with restriction enzymes MluCI and NlaIII. The bridged genomic regions are enriched using streptavidin beads and PCR-amplified for sequencing after ligation of a universal adapter. b Hi-TrAC reproducibly detects interactions around the Sox2 gene locus from 106, 105, and 104 E14 mESCs. ATAC-seq data were obtained from GSM1830114. Hi-TrAC virtual 4 C signals were generated by only keeping PETs interacting with the + /− 1 kb TSS region of Sox2 gene and displayed as the piled up 1D signal. Interacting PETs were shown as dots below the 4C-like signals. The genomic annotations are shown on the top of the panel. The visualization was performed with cLoops2 plot module. c Comparison of interactions around Klf4 gene locus from pooled MCC, Hi-TrAC, and Micro-C data in mESCs. Only intra-chromosomal PETs from Hi-TrAC and Micro-C were used for comparisons. d Correlation analysis between interactions detected by MCC with the virtual 4 C signals from Hi-TrAC or Micro-C data around Klf4, Sox2, and Myc loci, with the viewpoint set as the + /− 1 kb of TSS. Source data are provided as a Source Data file. e Distribution of correlations between the virtual 4 C signals from Hi-TrAC and Micro-C around the promoter regions of all protein-coding genes. The promoter defined as a region + /− 1Kb upstream and downstream of a TSS was set as the viewpoint. Only PETs with any end located in the promoter region were kept, and a region of 250Kb upstream and downstream of TSSs was set as the comparing region. PCC stands for Pearson Correlation Coefficient. f Aggregation analysis of Hi-TrAC and Micro-C loops. Hi-TrAC loops were called by the cLoops2 callLoops module and requiring at least 20 PETs (Supplementary Data 2), and Micro-C loops were called by HiCCUPS. g Overlaps of Hi-TrAC and Micro-C loops. h Genome Browser snapshot of the Lefty locus, showing the distribution of ATAC-seq peaks and chromatin loops detected by Hi-TrAC and Micro-C as well as the interaction matrices at a 200 bp resolution.
Fig. 2
Fig. 2. Chromatin looping networks constructed with Hi-TrAC data.
a Genome Browser snapshot showing the chromatin loops detected by Hi-TrAC around the SPI1 gene in GM12878 cells. Loops are shown as arches, and the numbers of PETs are also shown for each loop. Loops were called by the cLoops2 callLoops module, requiring at least ten supportive PETs. The interaction matrices are displayed at the bottom. b Aggregation analysis of 91,042 loops called from Hi-TrAC data in GM12878 (Supplementary Data 3). Interacting PETs in loops and their nearby regions (5-folds upstream and downstream of loop anchors) as matrices were averaged as the aggregated heatmap. ES stands for enrichment score, indicating the interaction signal enrichment compared to neighbor regions. The analysis was performed with cLoops2 agg module. c Summary of categories of GM12878 Hi-TrAC loops with regard to putative cis-regulatory elements, including enhancers, promoters and others. d Summary of categories of GM12878 Hi-TrAC loops with regard to the orientation of CTCF motifs at the two anchors of a loop. e Aggregation analysis of cell-specific loops in GM12878 and K562 (Supplementary Data 4). Differentially enriched loops were called with the cLoops2 callDiffLoops module. f The distribution of expression levels of the genes associated with cell-specific loops, and the genes with promoters looping with alternative enhancers between GM12878 and K562. The numbers of genes for each category were indicated. The box extends from the first quartile to the third quartile of the data, with a line at the median. The whiskers extend from the box by 1.5x the inter-quartile range. Flier points past the end of the whiskers were not shown. Source data are provided as a Source Data file. g Rehoboam plots showing the differences in promoter-enhancer interactions at RUNX1 gene locus in GM12878 and K562 cells. Interactions from the viewpoints of enhancers E6, E14, and E20 are shown. Source data are provided as a Source Data file. h An example of the longest connected sub-network consisting of enhancers and promoters on Chromosome 21 in GM12878. Enhancers and promoters form complex connections as nature scale-free regulatory networks. Source data are provided as a Source Data file.
Fig. 3
Fig. 3. Division of labor in regulating different categories of chromatin loops by distinct transcription factors.
a The top 15 transcription factors associated with the Hi-TrAC loop anchors in GM12878 and K562 cells. The binding sites of 162 and 360 transcription factors were compiled from the ReMap 2020 for GM12878 and K562, respectively. The top 15 factors most significantly associated with loop anchors, sorted by consistency, are shown as indicated on the left of the panel (Supplementary Data 5). Overlapped top factors between GM12878 and K562 are highlighted in purple and blue. Fg stands for foreground data, which means the actual loops. Bg stands for background data, which means regions nearby actual loop anchors and used as controls. Source data are provided as a Source Data file. b The distribution of loops (top panel) bound by HCFC1, CTCF, RAD21, and ZNF143 alone or in combination (bottom panel) at both anchors in GM12878. Source data are provided as a Source Data file. c Summary of loop categories with regard to putative cis-regulatory elements for loops co-bound by HCFC1 plus ZNF143 and loops co-bound by CTCF plus RAD21 in GM12878. d An example of promoter-promoter loops co-bound by HCFC1 plus ZNF143 but not CTCF plus RAD21. e The distribution of anchor distance for loops co-bound by HCFC1 plus ZNF143 and loops co-bound by CTCF plus RAD21 in GM12878. The box extends from the first quartile to the third quartile of the data, with a line at the median. The whiskers extend from the box by 1.5x the inter-quartile range. Flier points past the end of the whiskers were not shown. n = the number of loops. Source data are provided as a Source Data file. f The expression levels of genes with promoter-promoter loops co-bound by HCFC1 plus ZNF143 and other genes in GM12878. The box extends from the first quartile to the third quartile of the data, with a line at the median. The whiskers extend from the box by 1.5x the inter-quartile range. Flier points past the end of the whiskers were not shown. n = the number of genes. Source data are provided as a Source Data file.
Fig. 4
Fig. 4. HCFC1 and ZNF143 contribute to organizing chromatin looping.
a Aggregation analysis reveals decreases in chromatin looping intensity after knocking down CTCF, RAD21, HCFC1, and ZNF143 in K562 cells (Supplementary Data 6). Enrichment score (ES) is the mean value of all enrichment scores for individual loops. KD, knockdown. b Summary of loop categories with regard to putative cis-regulatory elements for decreased loops in the TF (transcription factor) knockdown cells. c The genomic distance distribution of changed loops after TF knockdown. The box extends from the first quartile to the third quartile of the data, with a line at the median. The whiskers extend from the box by 1.5x the inter-quartile range. Flier points past the end of the whiskers were not shown. n = the number of loops. Source data are provided as a Source Data file. d An example of domain disruption at the genomic region upstream of MYC gene detected by Hi-TrAC after knocking down RAD21 or CTCF with RAD21. e In situ Hi-C data shows the disruption of chromatin domains in the same region as in panel d after knocking down CTCF and RAD21 (Supplementary Data 8). f Loop aggregation analysis for significantly decreased loops detected by Hi-TrAC using the same in situ Hi-C data as in panel e.
Fig. 5
Fig. 5. HCFC1 and ZNF143 regulate gene expression through organizing promoter-promoter looping.
a Chromatin loops detected by Hi-TrAC are shown for the ZNF gene cluster on Chromosome 19 in K562 cells. Also shown are ENCODE ChIP-seq signals of active histone modifications and 4 TFs (H3K4me1, 2, 3, and H3K27ac, CTCF, RAD21, HCFC1, and ZNF143). Putative promoters co-bound by HCFC1 and ZNF143 with loops are annotated as P1 to P7, and putative promoters co-bound by HCFC1 and ZNF143 but no loops detected are annotated as N1 to N4. The non-promoter region showing loops and co-bound by HCFC1 and ZNF143 is annotated as E1, and the region showing looping with other region but no HCFC1 and ZNF143 binding are annotated as E2. b Rehoboam plots of chromatin looping in control and knockdown cells for the ZNF cluster region as annotated in panel a. Source data are provided as a Source Data file. KD, knockdown. c The expression changes of the ZNF genes by knocking down CTCF, RAD21, HCFC1, and ZNF143 in K562 cells as measured by RNA-seq. d Binding profiles of CTCF, RAD21, HCFC1, and ZNF143 at ZNF gene cluster region detected by ChIP-seq in control, CTCF plus RAD21 double knockdown or HCFC1 plus ZNF143 double knockdown K562 cells.

Similar articles

Cited by

References

    1. Naumova N, et al. Organization of the mitotic chromosome. Science. 2013;342:948–953. - PMC - PubMed
    1. Bonev B, Cavalli G. Organization and function of the 3D genome. Nat. Rev. Genet. 2016;17:661–678. - PubMed
    1. Rowley MJ, Corces VG. Organizational principles of 3D genome architecture. Nat. Rev. Genet. 2018;19:789–800. - PMC - PubMed
    1. Gibcus JH, Dekker J. The hierarchy of the 3D genome. Mol. Cell. 2013;49:773–782. - PMC - PubMed
    1. Misteli T. The self-organizing genome: principles of genome architecture and function. Cell. 2020;183:28–45. - PMC - PubMed

Publication types

MeSH terms