

DNA methylome in pancreatic cancer identified novel promoter hyper-methylation in NPY and FAIM2 genes associated with poor prognosis in Indian patient cohort
- PMID: 36329447
- PMCID: PMC9635159
- DOI: 10.1186/s12935-022-02737-1
DNA methylome in pancreatic cancer identified novel promoter hyper-methylation in NPY and FAIM2 genes associated with poor prognosis in Indian patient cohort
Abstract
Background: Pancreatic ductal adenocarcinoma (PDAC) is one of the leading cancers worldwide and has a poor survival, with a 5-year survival rate of only 8.5%. In this study we investigated altered DNA methylation associated with PDAC severity and prognosis.
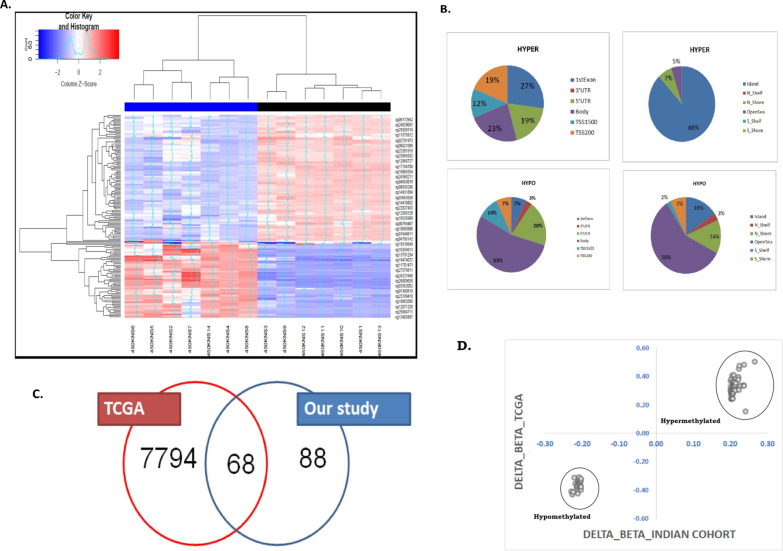
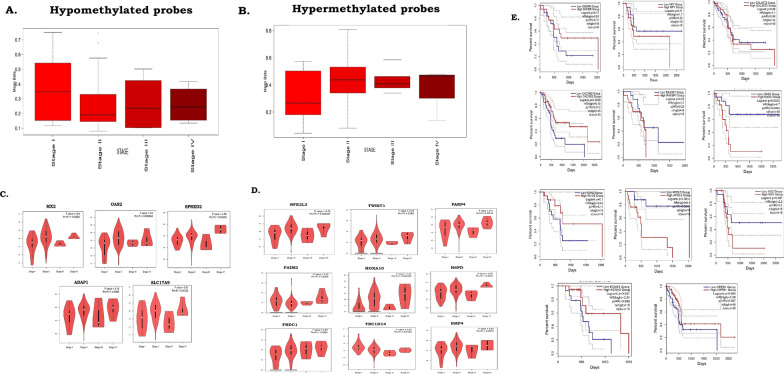
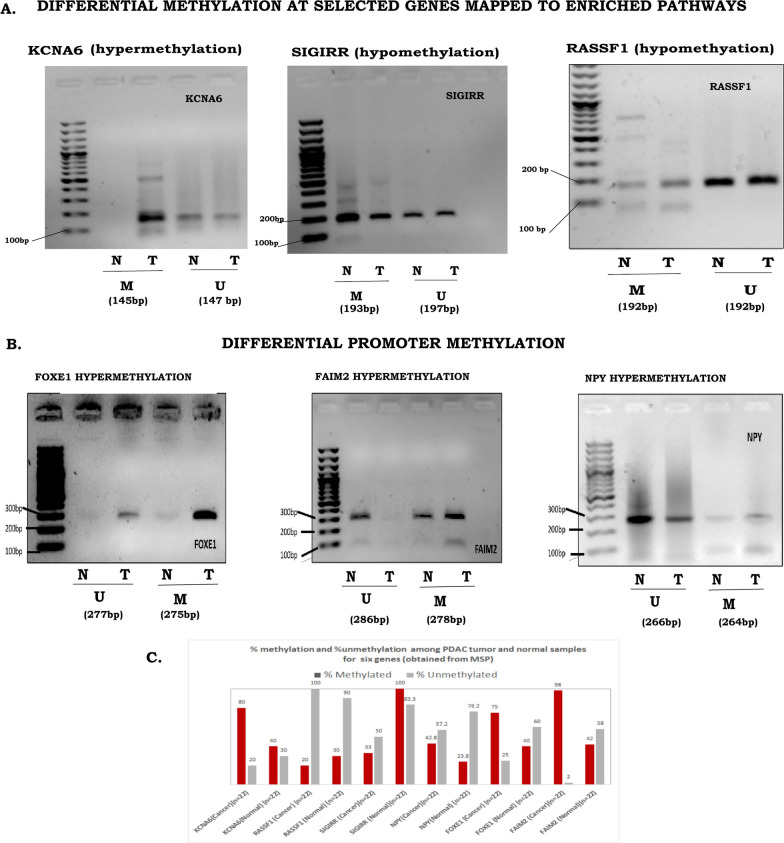
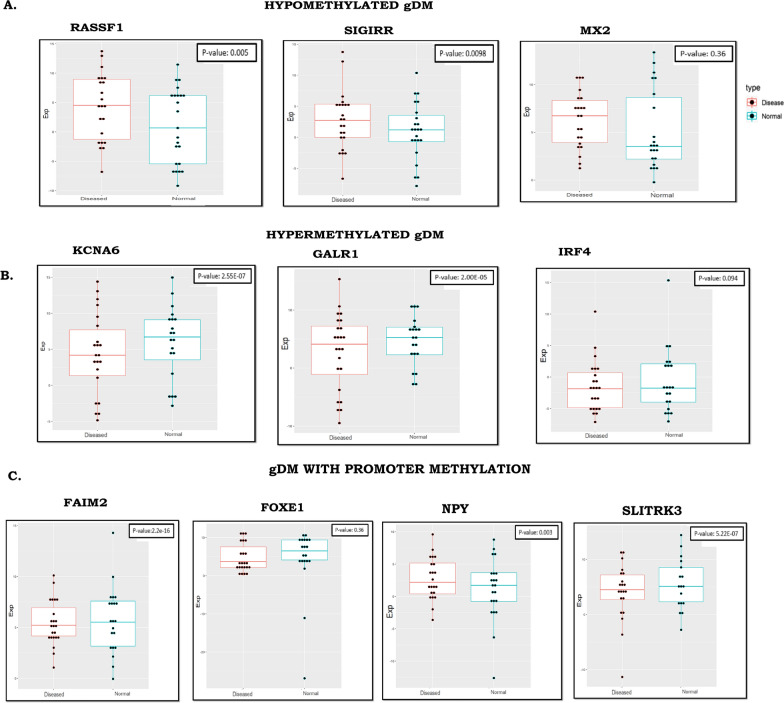
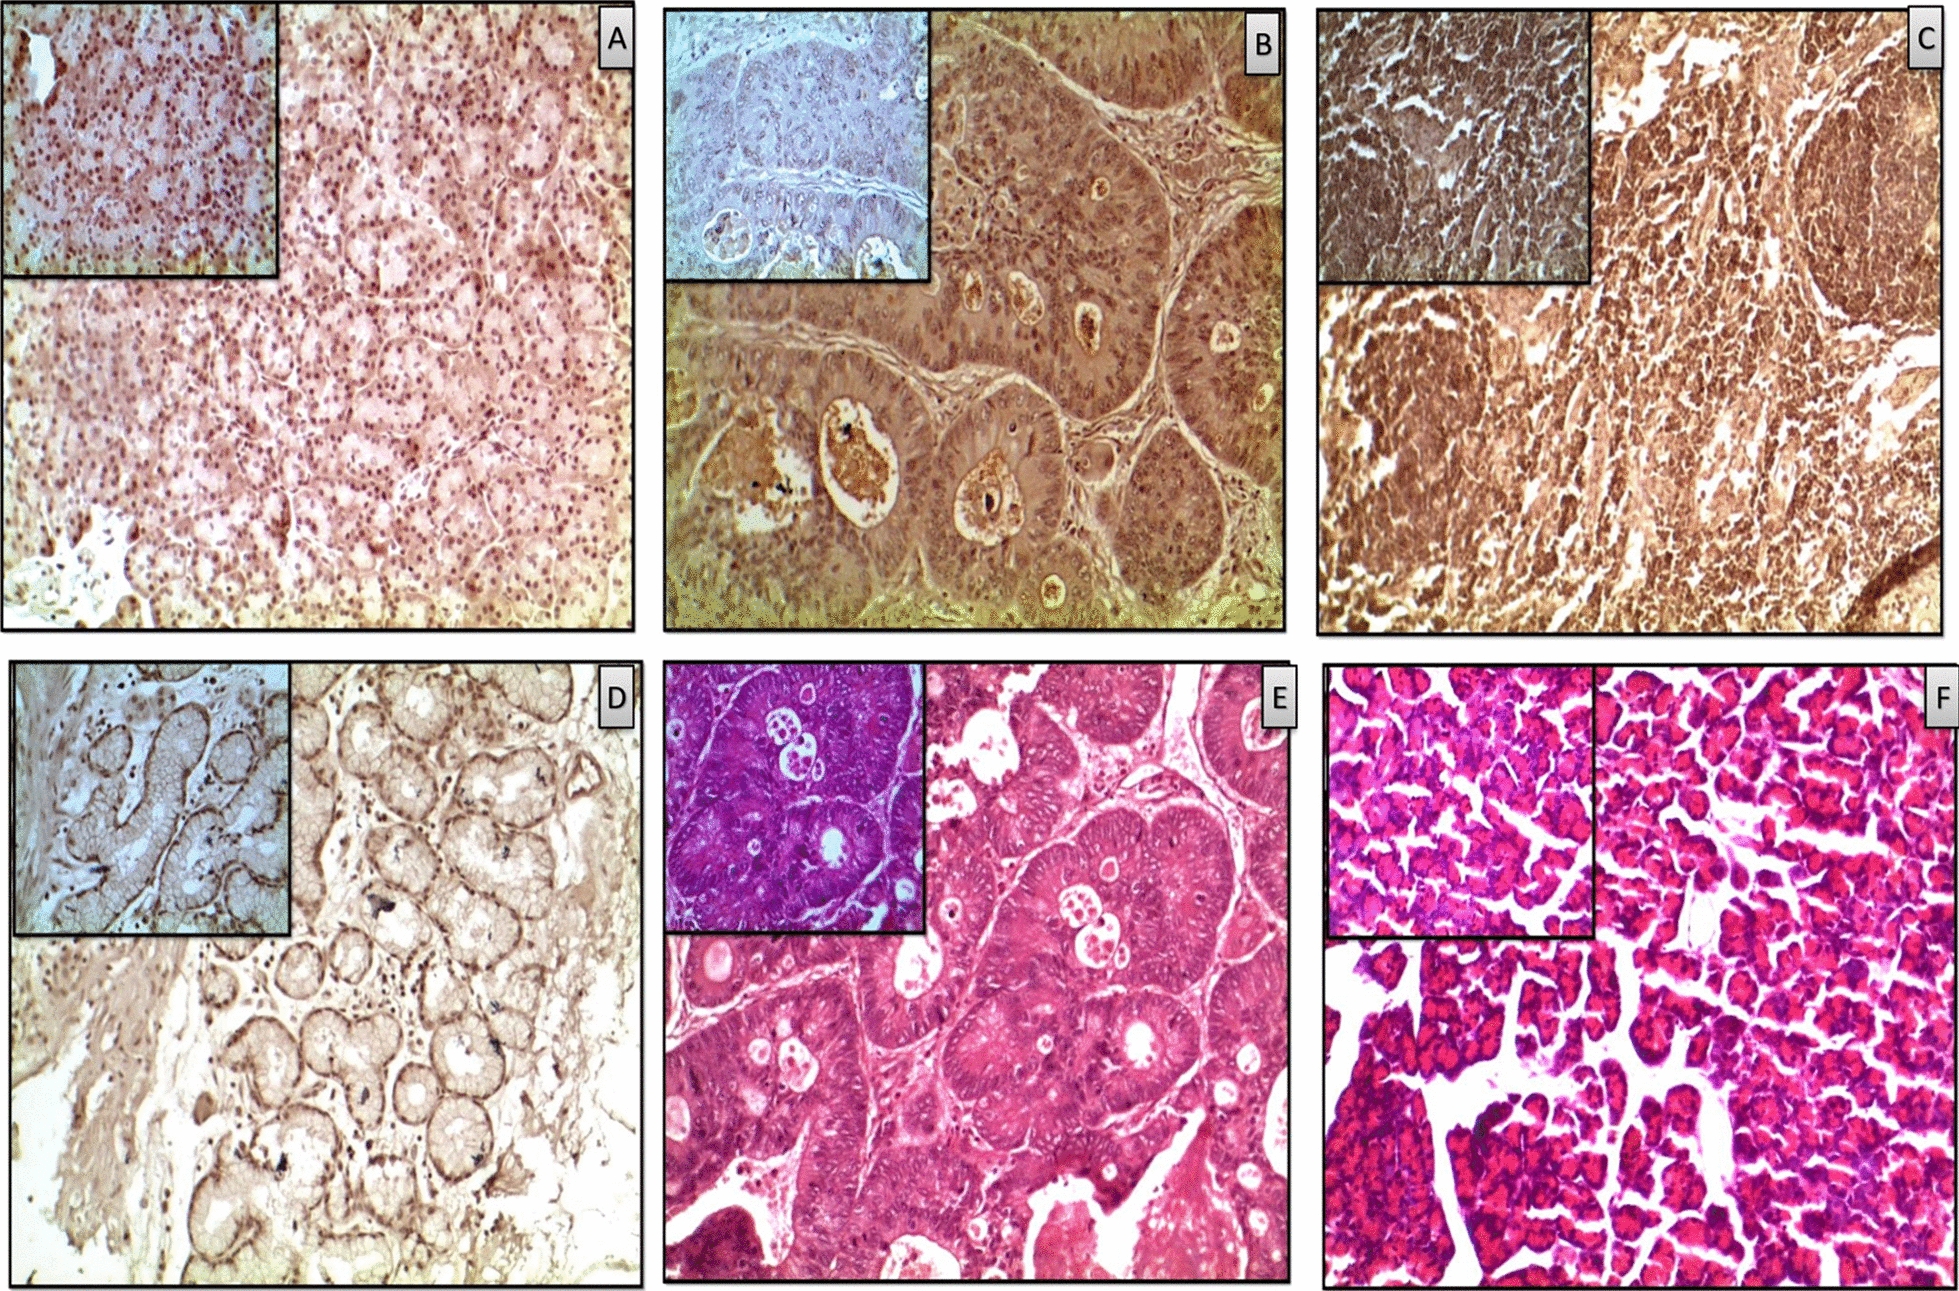
Methods: Methylome data, generated using 450 K bead array, was compared between paired PDAC and normal samples in the TCGA cohort (n = 9) and our Indian cohort (n = 7). The total Indian Cohort (n = 75) was split into cohort 1 (n = 7), cohort 2 (n = 22), cohort 3 (n = 26) and cohort 4 (n = 20).Validation of differential methylation (6 selected CpG loci) and associated gene expression for differentially methylated genes (10 selected gDMs) were carried out in separate validation cohorts, using MSP, RT-PCR and IHC correlations between methylation and gene expression were observed in TCGA, GTEx cohorts and in validation cohorts. Kaplan-Meier survival analysis was done to study differential prognosis, during 2-5 years of follow-up.
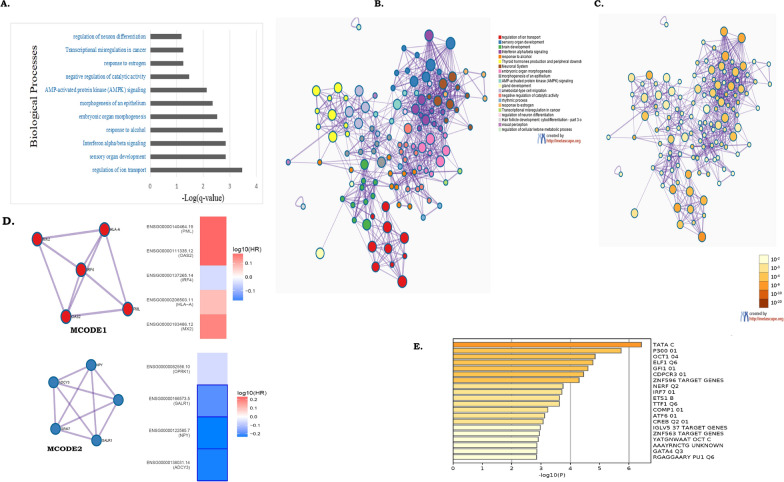
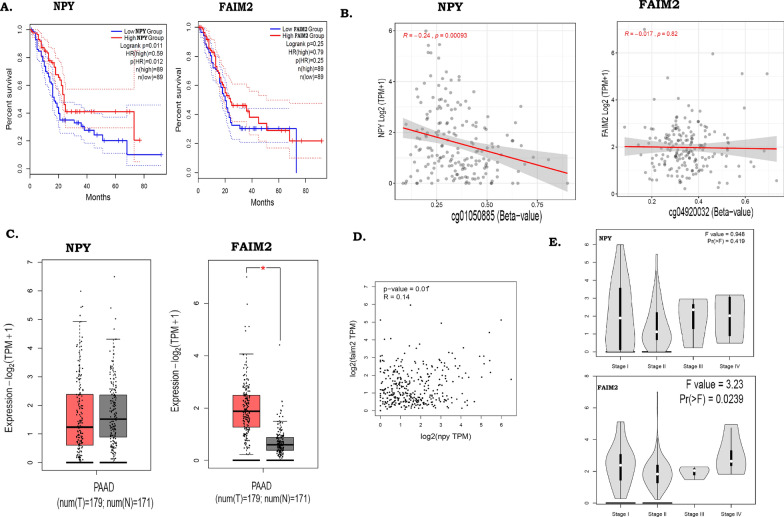
Results: We identified 156 DMPs, mapped to 91 genes (gDMs), in PDAC; 68 (43.5%) DMPs were found to be differentially methylated both in TCGA cohort and our cohort, with significant concordance at hypo- and hyper-methylated loci. Enrichments of "regulation of ion transport", "Interferon alpha/beta signalling", "morphogenesis and development" and "transcriptional dysregulation" pathways were observed among 91 gDMs. Hyper-methylation of NPY and FAIM2 genes with down-regulated expression in PDAC, were significantly associated with poor prognosis in the Indian patient cohort.
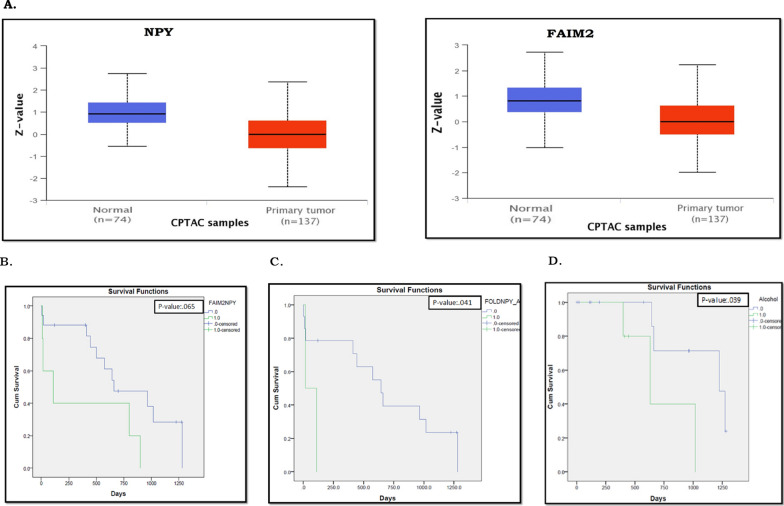
Conclusions: Ethnic variations among populations may determine the altered epigenetic landscape in the PDAC patients of the Indian cohort. Our study identified novel differentially methylated genes (mainly NPY and FAIM2) and also validated the previously identified differentially methylated CpG sites associated with PDAC cancer patient's survival. Comparative analysis of our data with TCGA and CPTAC cohorts showed that both NPY and FAIM2 hyper-methylation and down-regulations can be novel epigenetically regulated genes in the Indian patient population, statistically significantly associated with poor survival and advanced tumour stages.
Keywords: 450K DNA methylation; Epigenetically Dysregulated Signalling pathways; NPY and FAIM2hyper-methylation; Pancreatic-ductal adenocarcinoma; Poor survival; Prognostic epigenetic marker.
© 2022. The Author(s).
Conflict of interest statement
The authors don’t have any competing interest to disclose.
Figures
Similar articles
-
Deoxyribonucleic acid methylation driven aberrations in pancreatic cancer-related pathways.World J Gastrointest Oncol. 2023 Sep 15;15(9):1505-1519. doi: 10.4251/wjgo.v15.i9.1505. World J Gastrointest Oncol. 2023. PMID: 37746645 Free PMC article. Review.
-
Dipeptidyl peptidase like 6 promoter methylation is a potential prognostic biomarker for pancreatic ductal adenocarcinoma.Biosci Rep. 2020 Jul 31;40(7):BSR20200214. doi: 10.1042/BSR20200214. Biosci Rep. 2020. PMID: 32701143 Free PMC article.
-
High methylation levels of PCDH10 predict poor prognosis in patients with pancreatic ductal adenocarcinoma.BMC Cancer. 2019 May 14;19(1):452. doi: 10.1186/s12885-019-5616-2. BMC Cancer. 2019. PMID: 31088413 Free PMC article.
-
Survival Analysis of Multi-Omics Data Identifies Potential Prognostic Markers of Pancreatic Ductal Adenocarcinoma.Front Genet. 2019 Jul 18;10:624. doi: 10.3389/fgene.2019.00624. eCollection 2019. Front Genet. 2019. PMID: 31379917 Free PMC article.
-
Combined Analysis of the Aberrant Epigenetic Alteration of Pancreatic Ductal Adenocarcinoma.Biomed Res Int. 2019 Dec 28;2019:9379864. doi: 10.1155/2019/9379864. eCollection 2019. Biomed Res Int. 2019. PMID: 31956659 Free PMC article.
Cited by
-
Deoxyribonucleic acid methylation driven aberrations in pancreatic cancer-related pathways.World J Gastrointest Oncol. 2023 Sep 15;15(9):1505-1519. doi: 10.4251/wjgo.v15.i9.1505. World J Gastrointest Oncol. 2023. PMID: 37746645 Free PMC article. Review.
-
Emerging role of non-invasive and liquid biopsy biomarkers in pancreatic cancer.World J Gastroenterol. 2023 Apr 21;29(15):2241-2260. doi: 10.3748/wjg.v29.i15.2241. World J Gastroenterol. 2023. PMID: 37124888 Free PMC article. Review.
-
Targeted DNA Methylation Editing Using an All-in-One System Establishes Paradoxical Activation of EBF3.Cancers (Basel). 2024 Feb 23;16(5):898. doi: 10.3390/cancers16050898. Cancers (Basel). 2024. PMID: 38473261 Free PMC article.
References
-
- Siegel RL, Miller KD, Fuchs HE, Jemal A. Cancer statistics, 2022. CA Cancer J Clin. 2022;72:7–33. - PubMed
-
- Sung H, Ferlay J, Siegel RL, Laversanne M, Soerjomataram I, Jemal A, et al. Global Cancer Statistics 2020: GLOBOCAN Estimates of incidence and mortality worldwide for 36 cancers in 185 countries. CA Cancer J Clin. 2021;71:209–249. - PubMed
-
- McGranahan N, Swanton C. Clonal heterogeneity and tumor evolution: past, present, and the future. Cell. 2017;168:613–628. - PubMed
-
- Chatterjee A, Rodger EJ, Eccles MR. Epigenetic drivers of tumourigenesis and cancer metastasis. Semin Cancer Biol. 2018;51:149–159. - PubMed
Grants and funding
LinkOut - more resources
Full Text Sources
Molecular Biology Databases
Research Materials
Miscellaneous
