Self-supervised machine learning for live cell imagery segmentation
- PMID: 36323790
- PMCID: PMC9630527
- DOI: 10.1038/s42003-022-04117-x
Self-supervised machine learning for live cell imagery segmentation
Abstract
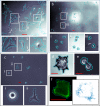
Segmenting single cells is a necessary process for extracting quantitative data from biological microscopy imagery. The past decade has seen the advent of machine learning (ML) methods to aid in this process, the overwhelming majority of which fall under supervised learning (SL) which requires vast libraries of pre-processed, human-annotated labels to train the ML algorithms. Such SL pre-processing is labor intensive, can introduce bias, varies between end-users, and has yet to be shown capable of robust models to be effectively utilized throughout the greater cell biology community. Here, to address this pre-processing problem, we offer a self-supervised learning (SSL) approach that utilizes cellular motion between consecutive images to self-train a ML classifier, enabling cell and background segmentation without the need for adjustable parameters or curated imagery. By leveraging motion, we achieve accurate segmentation that trains itself directly on end-user data, is independent of optical modality, outperforms contemporary SL methods, and does so in a completely automated fashion-thus eliminating end-user variability and bias. To the best of our knowledge, this SSL algorithm represents a first of its kind effort and has appealing features that make it an ideal segmentation tool candidate for the broader cell biology research community.
© 2022. This is a U.S. Government work and not under copyright protection in the US; foreign copyright protection may apply.
Conflict of interest statement
The authors declare no competing interests.
Figures


Similar articles
-
Automated cell segmentation for reproducibility in bioimage analysis.Synth Biol (Oxf). 2023 Jan 31;8(1):ysad001. doi: 10.1093/synbio/ysad001. eCollection 2023. Synth Biol (Oxf). 2023. PMID: 36819744 Free PMC article.
-
Ultrasound carotid plaque segmentation via image reconstruction-based self-supervised learning with limited training labels.Math Biosci Eng. 2023 Jan;20(2):1617-1636. doi: 10.3934/mbe.2023074. Epub 2022 Nov 3. Math Biosci Eng. 2023. PMID: 36899501
-
Unsupervised and semi-supervised learning: the next frontier in machine learning for plant systems biology.Plant J. 2022 Sep;111(6):1527-1538. doi: 10.1111/tpj.15905. Epub 2022 Jul 27. Plant J. 2022. PMID: 35821601 Review.
-
Weakly supervised segmentation on neural compressed histopathology with self-equivariant regularization.Med Image Anal. 2022 Aug;80:102482. doi: 10.1016/j.media.2022.102482. Epub 2022 May 25. Med Image Anal. 2022. PMID: 35688048
-
A review of self-supervised, generative, and few-shot deep learning methods for data-limited magnetic resonance imaging segmentation.NMR Biomed. 2024 Aug;37(8):e5143. doi: 10.1002/nbm.5143. Epub 2024 Mar 24. NMR Biomed. 2024. PMID: 38523402 Review.
Cited by
-
BIDCell: Biologically-informed self-supervised learning for segmentation of subcellular spatial transcriptomics data.Nat Commun. 2024 Jan 13;15(1):509. doi: 10.1038/s41467-023-44560-w. Nat Commun. 2024. PMID: 38218939 Free PMC article.
-
Automated cell segmentation for reproducibility in bioimage analysis.Synth Biol (Oxf). 2023 Jan 31;8(1):ysad001. doi: 10.1093/synbio/ysad001. eCollection 2023. Synth Biol (Oxf). 2023. PMID: 36819744 Free PMC article.
-
Bridging live-cell imaging and next-generation cancer treatment.Nat Rev Cancer. 2023 Nov;23(11):731-745. doi: 10.1038/s41568-023-00610-5. Epub 2023 Sep 13. Nat Rev Cancer. 2023. PMID: 37704740 Review.
-
Low-frequency ERK and Akt activity dynamics are predictive of stochastic cell division events.NPJ Syst Biol Appl. 2024 Jun 4;10(1):65. doi: 10.1038/s41540-024-00389-7. NPJ Syst Biol Appl. 2024. PMID: 38834572 Free PMC article.
References
Publication types
MeSH terms
LinkOut - more resources
Full Text Sources
Miscellaneous

