. 2022 Nov 15;66(11):e0028422.
doi: 10.1128/aac.00284-22. Epub 2022 Oct 31.

Drug Repurposing in Chagas Disease: Chloroquine Potentiates Benznidazole Activity against Trypanosoma cruzi In Vitro and In Vivo

Affiliations

Drug Repurposing in Chagas Disease: Chloroquine Potentiates Benznidazole Activity against Trypanosoma cruzi In Vitro and In Vivo

Ramendra P Pandey et al. Antimicrob Agents Chemother. .

Abstract

Drug combinations and drug repurposing have emerged as promising strategies to develop novel treatments for infectious diseases, including Chagas disease. In this study, we aimed to investigate whether the repurposed drugs chloroquine (CQ) and colchicine (COL), known to inhibit Trypanosoma cruzi infection in host cells, could boost the anti-T. cruzi effect of the trypanocidal drug benznidazole (BZN), increasing its therapeutic efficacy while reducing the dose needed to eradicate the parasite. The combination of BZN and COL exhibited cytotoxicity to infected cells and low antiparasitic activity. Conversely, a combination of BZN and CQ significantly reduced T. cruzi infection in vitro, with no apparent cytotoxicity. This effect seemed to be consistent across different cell lines and against both the partially BZN-resistant Y and the highly BZN-resistant Colombiana strains. In vivo experiments in an acute murine model showed that the BZN+CQ combination was eight times more effective in reducing T. cruzi infection in the acute phase than BZN monotherapy. In summary, our results demonstrate that the concomitant administration of CQ and BZN potentiates the trypanocidal activity of BZN, leading to a reduction in the dose needed to achieve an effective response. In a translational context, it could represent a higher efficacy of treatment while also mitigating the adverse effects of high doses of BZN. Our study also reinforces the relevance of drug combination and repurposing approaches in the field of Chagas disease drug discovery.

Keywords: Chagas disease drug discovery; benznidazole; chloroquine; drug combination; drug repurposing.


Conflict of interest statement

The authors declare no conflict of interest.

Figures
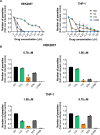
FIG 1
FIG 1
Activity of drugs and drug combinations against T. cruzi Y strain in HEK293T and THP-1 cell lines. Cells were infected with trypomastigotes of the Y strain at an MOI of 10 and treated with different concentrations of drugs (100 to 0.78 μM). For the combinatory treatment (COMB), COL and CQ at 5 μM were combined with variable concentrations of BZN (100 to 0.78 μM). Treatment was performed every other day up to 144 h for HEK293T cells and 192 h for THP1 cells when the number of trypomastigotes released in culture supernatant was determined by parasite counting. (A) Effect of different concentrations of BZN, COL, CQ, and drug combinations on trypomastigote release. (B) Comparison of BZN, COL, and CQ activities at 0.78 and 1.56 μM on both cell lines. In combination treatment, “COMB” refers to 5 μM COL and CQ with either 1.56 or 0.78 μM BZN. Results are based on the quantification of the number of trypomastigotes released in supernatant and are shown as fold change compared to nontreated infected control. Data represent average ± SD of two independent experiments.
FIG 2
FIG 2
Activity of drugs and drug combinations against the T. cruzi Colombiana strain in the THP-1 cell line. Cells were infected with Colombiana strain at an MOI of 10 and treated with different concentrations of drugs (100 to 3.125 μM). For the combinatory treatment, COL and CQ at 5 μM were combined with variable concentrations of BZN (100 to 3.125 μM). Treatment was performed every other day up to 192 h (peak day of trypomastigote release) when the number of trypomastigotes released in culture supernatant was determined by parasite counting. (A) Effect of different concentrations of BZN, COL, CQ, and drugs combination in trypomastigote release. (B and C) Comparison of BZN, COL, and CQ activities at 12.5 and 25 μM. In combination treatment, “COMB” refers to 5 μM COL and CQ with either 12.5 or 25 μM BZN. Results are based on the quantification of the number of trypomastigotes released in supernatant and are shown as fold change compared to nontreated infected control. Data represent average ± SD of two independent experiments.
FIG 3
FIG 3
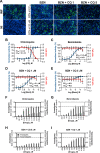
Efficacy of drugs and drug combinations against T. cruzi intracellular amastigotes. U2OS in 96-well plates were infected with T. cruzi Y strain at an MOI of 30 and treated with compounds in serial dilution by a factor of 3-fold. The following concentrations were used: 400 to 0.02 μM for BZN and 80 to 0.004 μM for CQ. For the combinatory treatment, fixed concentrations of CQ at either 1 or 5 μM were combined with variable concentrations of BZN (400 to 0.02 μM). Treatment was performed every other day up to 144 h when the number of trypomastigotes released in culture supernatant was determined by parasite counting, and the number of intracellular amastigotes and the infection ratio was determined by high content analysis. (A) Representative images of T. cruzi-infected U2OS cells in the assay endpoint (144 h postinfection), showing both infected (DMSO treated) and noninfected controls as well as the treatment with BZN alone and combined with CQ at 1 and 5 μM. (B to E) Dose-response curves of BZN, CQ, and drug combinations. The x axis indicates the log of compound concentration (molar); the left y axis (blue color curves) indicates the normalized antiparasitic activity, which represents the inhibition of infection in relation to controls; and the right y axis (red color curves) indicates compounds cytotoxicity, which represents the reduction of host cells number in relation to infected control. Values presented in graphs refer to both EC50 and CC50 values and represent average ± SD of four independent experiments. (F to I) Effect of drugs and drug combinations on both intracellular amastigote number and trypomastigote number. As indicated, the left y axis refers to the number of intracellular amastigotes (dark gray bars), and the right y axis refers to the number of trypomastigotes released in supernatant of infected cells (light gray bars). Data represent average ± SD of three (amastigotes) and two (trypomastigotes) independent experiments.
FIG 4
FIG 4
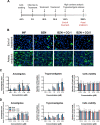
Dynamics of T. cruzi infection after drugs removal. LLC-MK2 cell line in 96-well plates was infected with T. cruzi Y strain at an MOI of 10 and treated with compounds in serial dilution by a factor of 3. For BZN alone, the following concentrations were used: 133.3, 14.8, 1.6, 0.18, and 0.02 μM. For the combinatory treatment, fixed concentrations of CQ at either 1 or 5 μM were combined with variable concentrations of BZN (133.3 to 0.02 μM). Treatment was performed every other day up to 144 h when drugs were removed, and cultures were maintained for an additional period of 144 h. Analyses were performed at two time points, at the end of treatment and at the assay endpoint, by counting trypomastigotes released in culture supernatant and by determining the number of intracellular amastigotes (high content analysis). (A) Schematic representation of washout assay. (B) Representative images of T. cruzi-infected LLC-MK2 cells at the end of treatment (144 hpi) and at assay endpoint (288 hpi), showing both infected and noninfected controls as well as the treatment with BZN alone and combined with CQ at 1 and 5 μM. (C and D) Effect of BZN alone and in combination with CQ considering the end of treatment and assay endpoint, respectively. As indicated by colors legend, BZN alone (gray), BZN + CQ 1 μM (blue), and BZN + CQ 5 μM (pink). Results are based on the quantification of both amastigotes area and number of trypomastigotes released in supernatant and are shown as fold change compared to nontreated infected control. Data represent average ± SD of three (amastigotes) and two (trypomastigotes) independent experiments.
FIG 5
FIG 5
In vitro drug interactions between benznidazole and chloroquine. (A and B) Dose-response curves of benznidazole and chloroquine, respectively, for each drug combination as follows: 5:0, 4:1, 3:2, 2:3, 1:4, and 0:5. The x axis indicated the log of compound concentration (molar), and the y axis indicates the normalized antiparasitic activity. (C) Isobologram representing the in vitro interaction between BZN and CQ. Each dot shows the FIC50 values for both drugs in each drug combination. The dotted line represents the theoretical line of additivity. The xΣFIC for all drug combinations is highlighted at the upper right corner. Data represent four independent experiments.
FIG 6
FIG 6
Therapeutic efficacy of drugs and drug combination in animal models. Female BALB/c mice were infected intraperitoneally with 5,000 blood trypomastigote forms of Colombian strain of T. cruzi. Gavage treatments of BZN 100 mg/kg/day, BZN 25 mg/Kg/day, CQ 50 mg/kg/day, and the combination of BZN 25 mg/kg/day plus CQ 50 mg/kg/day were administered daily for 20 consecutive days starting at 10 dpi. Parasitemia was assessed by optical microscopy every 5 days, starting on the first day of treatment (10 dpi) up to the assay endpoint (30 dpi). Each group was composed of 7 mice. Data are shown as mean ± standard error of the mean (SEM). Statistical analysis is shown in Table S2 in the supplemental material.

Similar articles

Cited by

References

    1. World Health Organization. 2022. Chagas disease (also known as American trypanosomiasis). World Health Organization, Geneva, Switzerland. https://www.who.int/news-room/fact-sheets/detail/chagas-disease-(america....
    1. Lee BY, Bacon KM, Bottazzi ME, Hotez PJ. 2013. Global economic burden of Chagas disease: a computational simulation model. Lancet Infect Dis 13:342–348. 10.1016/S1473-3099(13)70002-1. - DOI - PMC - PubMed
    1. Kratz JM. 2019. Drug discovery for chagas disease: a viewpoint. Acta Trop 198:105107. 10.1016/j.actatropica.2019.105107. - DOI - PubMed
    1. Lidani KCF, Andrade FA, Bavia L, Damasceno FS, Beltrame MH, Messias-Reason IJ, Sandri TL. 2019. Chagas disease: from discovery to a worldwide health problem. Front Public Heal 7:166. 10.3389/fpubh.2019.00166. - DOI - PMC - PubMed
    1. Barbosa AP, Cardinalli-Neto A, Otaviano AP, da Rocha BF, Bestetti RB. 2011. Comparison of outcome between Chagas cardiomyopathy and idiopathic dilated cardiomyopathy. Arq Bras Cardiol 97:517–525. 10.1590/S0066-782X2011005000112. - DOI - PubMed

Publication types