

Subcellular location of source proteins improves prediction of neoantigens for immunotherapy
- PMID: 36314681
- PMCID: PMC9753441
- DOI: 10.15252/embj.2022111071
Subcellular location of source proteins improves prediction of neoantigens for immunotherapy
Abstract
Antigen presentation via the major histocompatibility complex (MHC) is essential for anti-tumor immunity. However, the rules that determine which tumor-derived peptides will be immunogenic are still incompletely understood. Here, we investigated whether constraints on peptide accessibility to the MHC due to protein subcellular location are associated with peptide immunogenicity potential. Analyzing over 380,000 peptides from studies of MHC presentation and peptide immunogenicity, we find clear spatial biases in both eluted and immunogenic peptides. We find that including parent protein location improves the prediction of peptide immunogenicity in multiple datasets. In human immunotherapy cohorts, the location was associated with a neoantigen vaccination response, and immune checkpoint blockade responders generally had a higher burden of neopeptides from accessible locations. We conclude that protein subcellular location adds important information for optimizing cancer immunotherapies.
Keywords: Immunotherapy; immunogenicity; major histocompatibility complex; neoantigen; subcellular location.
© 2022 The Authors. Published under the terms of the CC BY 4.0 license.
Figures
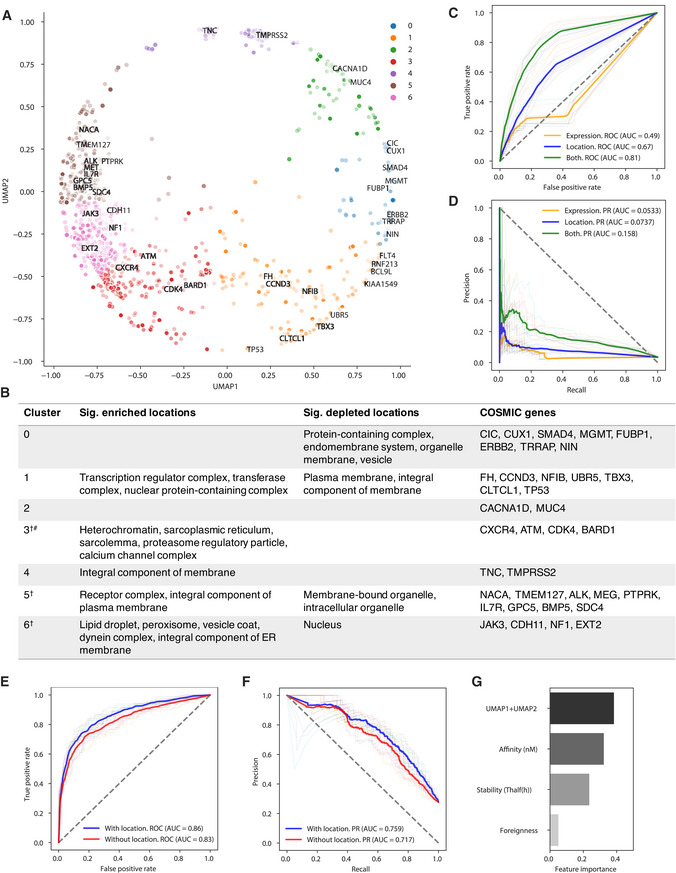
- A
Scatterplot of clustered UMAP location features (Materials and Methods) for source proteins of IEDB T‐cell assayed neoepitopes with COSMIC cancer genes highlighted.
- B
Table annotating location clusters from the scatterplot with highlighted COSMIC cancer genes. †PANTHER GO Slim CC used here for simplified terms. #Many terms so only the top five are shown.
- C, D
(C) Area under the receiver operating characteristic curve (AUROC) and (D) area under the precision–recall curve (AUPRC) for 10‐fold cross‐validation using a Random Forest model to predict protein elution in 721.221 B cells incorporating location, matched expression, or both (Materials and Methods). The faded lines indicate the respective area under the curve for each split.
- E, F
(E) AUROC and (F) AUPRC for 10‐fold cross‐validation using a Random Forest model to predict immunogenicity in IEDB assayed neopeptides incorporating peptide affinity, stability, and foreignness (Materials and Methods) with and without parent protein location features.
- G
Barplot of model feature importance.
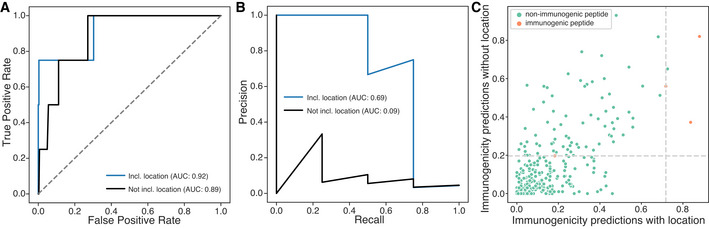
- A, B
(A) Area under the receiver operating characteristic curve (AUROC) (B) and area under the precision–recall curve (AUPRC) for the unseen validation dataset with and without parent protein location features.
- C
Scatterplot of the predicted probabilities for unseen test neopeptides to be immunogenic with and without location as a feature. Dashed lines indicate the Youden index for each model, used for optimal threshold predictions. False positives are reduced in the model with location.
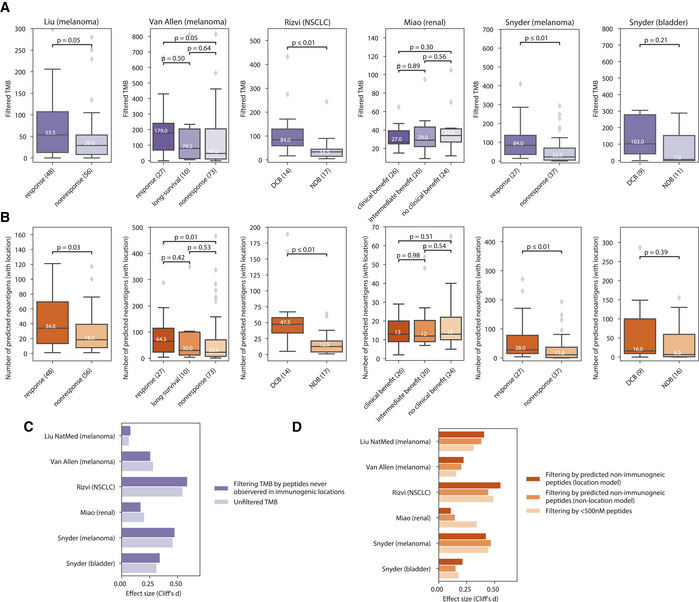
- A
Predicted neoantigen burden versus response category in immunotherapy cohorts when retaining only mutations in proteins from subcellular locations previously observed to source immunogenic peptides.
- B
Predicted neoantigen burden versus response category in immunotherapy cohorts where neoantigen status is predicted using a model trained on three sources of immunogenic peptide and features including peptide–MHC affinity, stability, and location.
- C, D
Barplots of effect sizes between responders and non‐responders (C) where TMB is filtered to include only mutations from subcellular locations previously observed to source immunogenic peptides and (D) where neoantigen status is predicted using a model trained on three sources of immunogenic peptide and MHC affinity and stability, with and without location.
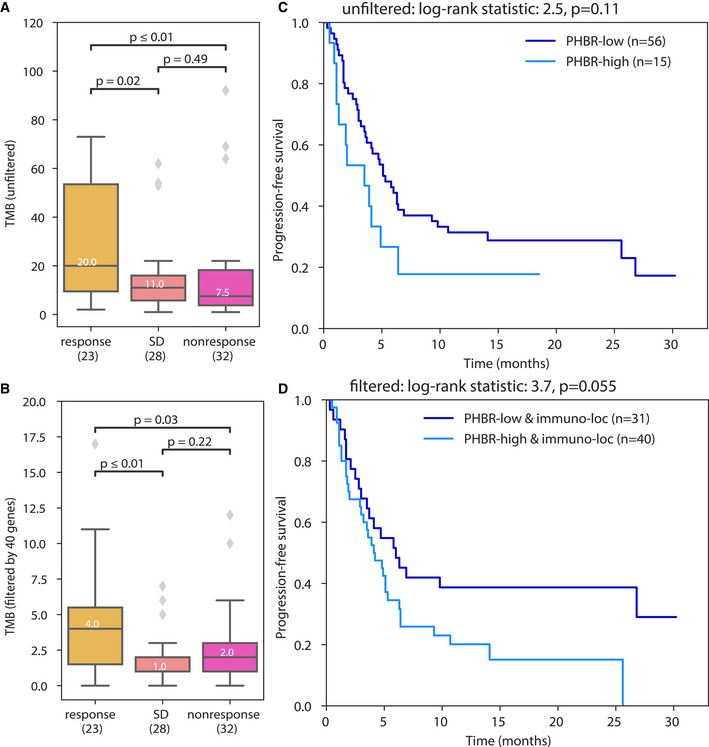
- A, B
Tumor mutation burden focusing on (A) all genes in the gene panel and (B) the 40 genes whose proteins localize to previously observed immunogenic subcellular locations.
- C, D
Kaplan–Meier curves showing the effect of the best presented mutation on progression‐free survival (C) using all genes in the panel and (D) using only the 40 genes of interest.
Similar articles
-
Immune-based mutation classification enables neoantigen prioritization and immune feature discovery in cancer immunotherapy.Oncoimmunology. 2021 Jan 15;10(1):1868130. doi: 10.1080/2162402X.2020.1868130. Oncoimmunology. 2021. PMID: 33537173 Free PMC article.
-
Neoantigen Dissimilarity to the Self-Proteome Predicts Immunogenicity and Response to Immune Checkpoint Blockade.Cell Syst. 2019 Oct 23;9(4):375-382.e4. doi: 10.1016/j.cels.2019.08.009. Epub 2019 Oct 9. Cell Syst. 2019. PMID: 31606370 Free PMC article.
-
TLimmuno2: predicting MHC class II antigen immunogenicity through transfer learning.Brief Bioinform. 2023 May 19;24(3):bbad116. doi: 10.1093/bib/bbad116. Brief Bioinform. 2023. PMID: 36960769
-
Immunogenic peptide discovery in cancer genomes.Curr Opin Genet Dev. 2015 Feb;30:7-16. doi: 10.1016/j.gde.2014.12.003. Epub 2015 Jan 12. Curr Opin Genet Dev. 2015. PMID: 25588790 Free PMC article. Review.
-
Application of mass spectrometry-based MHC immunopeptidome profiling in neoantigen identification for tumor immunotherapy.Biomed Pharmacother. 2019 Dec;120:109542. doi: 10.1016/j.biopha.2019.109542. Epub 2019 Oct 16. Biomed Pharmacother. 2019. PMID: 31629254 Review.
Cited by
-
Membrane-localized neoantigens predict the efficacy of cancer immunotherapy.Cell Rep Med. 2023 Aug 15;4(8):101145. doi: 10.1016/j.xcrm.2023.101145. Epub 2023 Aug 7. Cell Rep Med. 2023. PMID: 37552990 Free PMC article.
-
The diversification of methods for studying cell-cell interactions and communication.Nat Rev Genet. 2024 Jun;25(6):381-400. doi: 10.1038/s41576-023-00685-8. Epub 2024 Jan 18. Nat Rev Genet. 2024. PMID: 38238518 Review.
-
CD4 T cell-activating neoantigens enhance personalized cancer vaccine efficacy.JCI Insight. 2023 Dec 8;8(23):e174027. doi: 10.1172/jci.insight.174027. JCI Insight. 2023. PMID: 38063199 Free PMC article.
References
-
- Abelin JG, Harjanto D, Malloy M, Suri P, Colson T, Goulding SP, Creech AL, Serrano LR, Nasir G, Nasrullah Y et al (2019) Defining HLA‐II ligand processing and binding rules with mass spectrometry enhances cancer epitope prediction. Immunity 51: 766–779 - PubMed
