. 2022 Jun;2(6):417-433.
doi: 10.1158/2767-9764.crc-22-0017. Epub 2022 Jun 9.

The Tumor Immune Profile of Murine Ovarian Cancer Models: An Essential Tool For Ovarian Cancer Immunotherapy Research

Affiliations

The Tumor Immune Profile of Murine Ovarian Cancer Models: An Essential Tool For Ovarian Cancer Immunotherapy Research

Galaxia M Rodriguez et al. Cancer Res Commun. 2022 Jun.

Abstract

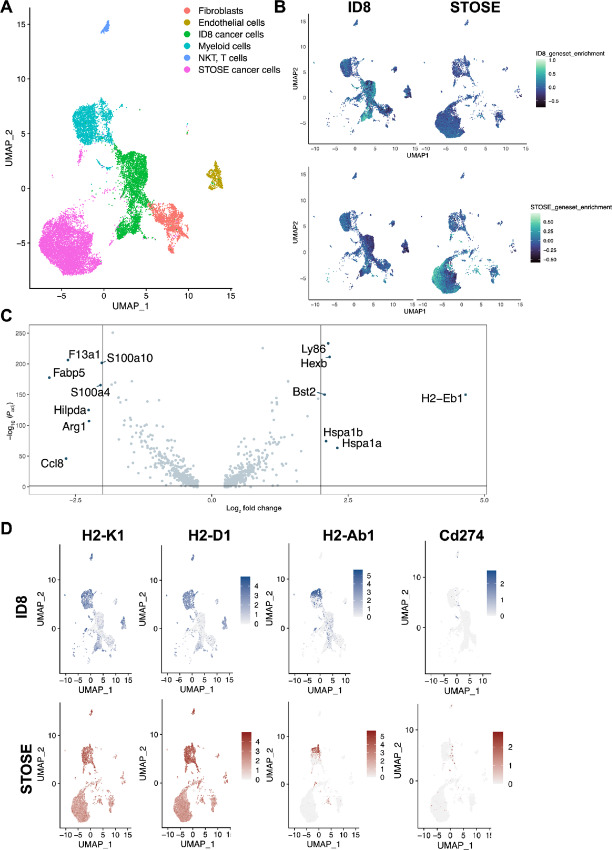
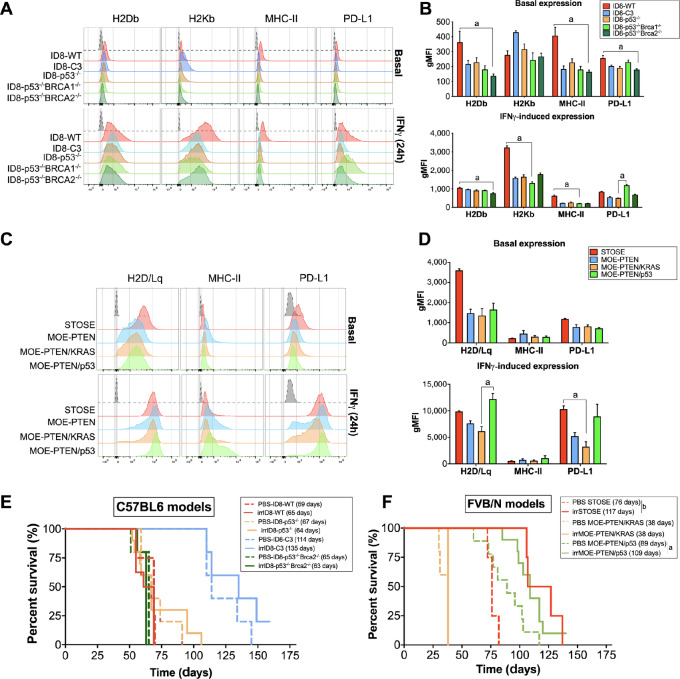
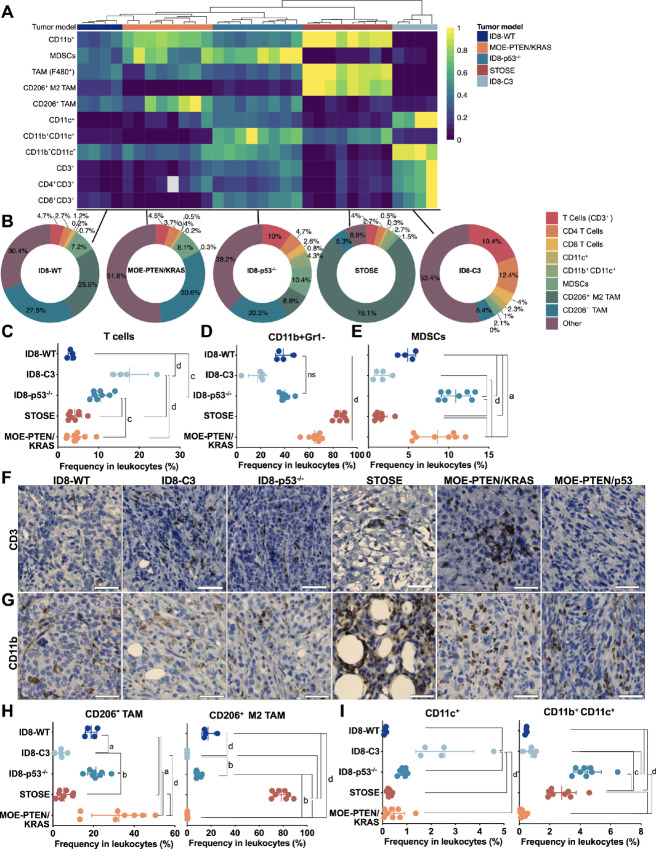
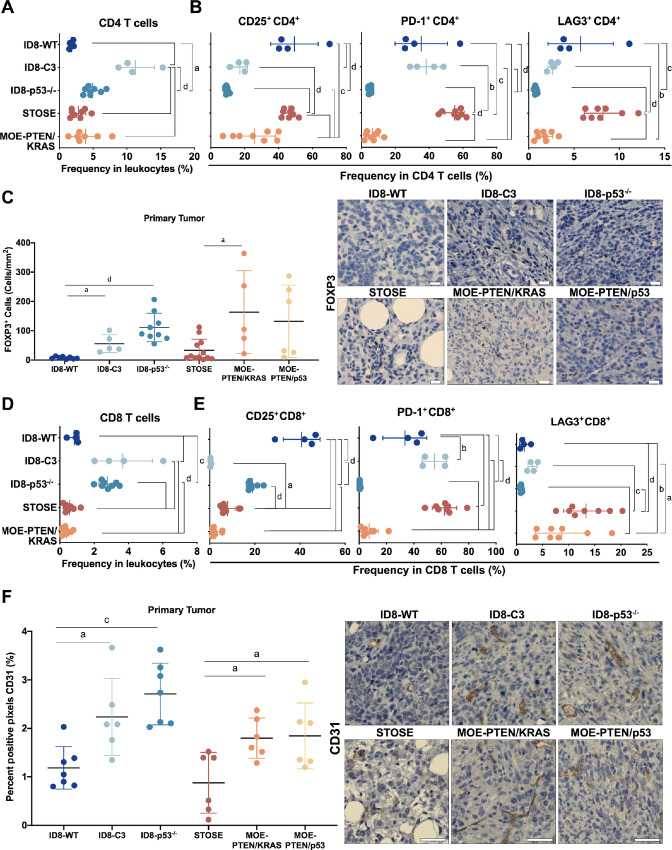
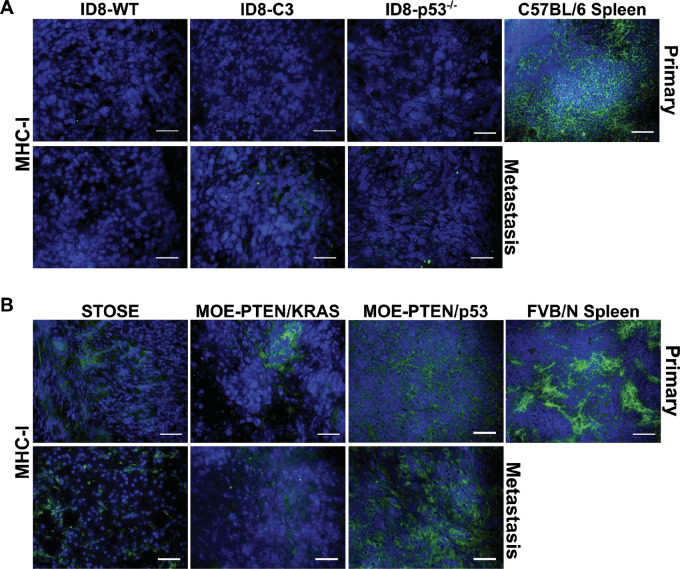
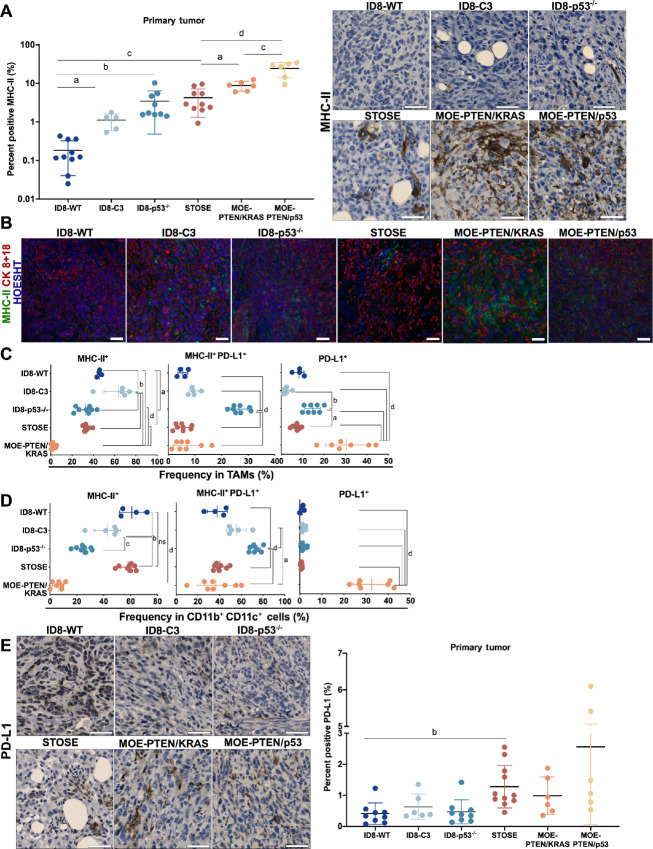
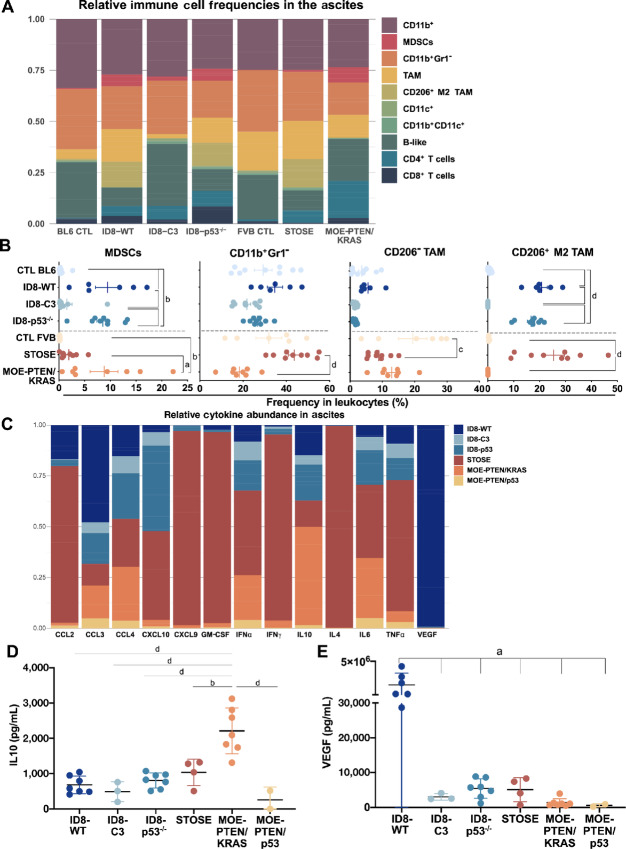
Epithelial ovarian cancer (EOC) is the most lethal gynecologic cancer with an imperative need for new treatments. Immunotherapy has had marked success in some cancer types; however, clinical trials studying the efficacy of immune checkpoint inhibitors for the treatment of EOC benefited less than 15% of patients. Given that EOC develops from multiple tissues in the reproductive system and metastasizes widely throughout the peritoneal cavity, responses to immunotherapy are likely hindered by heterogeneous tumor microenvironments (TME) containing a variety of immune profiles. To fully characterize and compare syngeneic model systems that may reflect this diversity, we determined the immunogenicity of six ovarian tumor models in vivo, the T and myeloid profile of orthotopic tumors and the immune composition and cytokine profile of ascites, by single-cell RNA sequencing, flow cytometry and IHC. The selected models reflect the different cellular origins of EOC (ovarian and fallopian tube epithelium) and harbor mutations relevant to human disease, including Tp53 mutation, PTEN suppression, and constitutive KRAS activation. ID8-p53-/- and ID8-C3 tumors were most highly infiltrated by T cells, whereas STOSE and MOE-PTEN/KRAS tumors were primarily infiltrated by tumor associated macrophages and were unique in MHC class I and II expression. MOE-PTEN/KRAS tumors were capable of forming T cell clusters. This panel of well-defined murine EOC models reflects some of the heterogeneity found in human disease and can serve as a valuable resource for studies that aim to test immunotherapies, explore the mechanisms of immune response to therapy, and guide selection of treatments for patient populations.

Keywords: cold versus hot tumors; immunogenicity; ovarian cancer; tumor infiltrating immune cells; tumor mutational burden.


Conflict of interest statement

Conflicts of Interest The authors declare no potential conflicts of interest.

Figures

FIGURE 1
FIGURE 1
scRNA-seq reveals high heterogeneity among STOSE and ID8 cancer cells. A, scRNA-seq UMAP figures depicting cell clusters found in orthotopic ID8-WT (left) and STOSE (right) tumors at endpoint. Tumors were integrated into a gene expression matrix containing expression values of 17,853 cells and 20,091 genes, using Seurat. B, UMAP plot showing enrichment of individual cancer cells for gene-sets generated for ID8 and STOSE cancer cell identity (Supplementary Table S4). C, Volcano plot showing the most differentially expressed genes (DGE) between myeloid cell populations of orthotopic ID8-WT (left) and STOSE-WT (right) tumors beyond log2 fold-change threshold of 2. DGEs calculated using MAST test comparing ID8 and STOSE myeloid cells head-to-head. D, UMAPs representing expression of MHC-I haplotypes H2-K1 and H2-D1, MHC-II haplotype H2-Ab1, and Cd274 in ID8-WT and STOSE orthotopic tumors. Heatmap displays the level of expression in each cell type cluster (as identified in A) in ID8-WT (blue) and STOSE (red) samples.
FIGURE 2
FIGURE 2
Ovarian cancer cell lines originating from FVB/N mice are more immunogenic. A–D,In vitro expression of MHC-I, MHC-II, and PD-L1 on ID8 and its derivative cell lines. Flow cytometry on single, viable cells. Fluorescence minus one (FMO) are depicted in gray. A, Histograms represent the mean fluorescence intensity (MFI) of each marker at basal levels (top) and after IFNγ treatment for 24 hours (bottom). B, IFNγ induction for the proteins of interest was quantified and depicted as geoMFI (n = 3). Significance was determined by Kruskal–Wallis test (a, P < 0.05). C, Histograms showing basal expression of MHC-I haplotypes, MHC-II and PD-L1 on STOSE and MOE cell lines, which are further induced by IFNγ treatment. gMFI quantification shown in D. E, Survival Kaplan–Meier plots of ovarian tumor-bearing mice from C57BL/6 strain and treated with syngeneic cellular vaccines. 5 × 10⁶ cancer cells were irradiated (100 Gy) and injected intraperitoneally two weeks after injection of the same number of viable cells. PBS was injected as a control. Curves represent mice as follows: n = 5 PBS for each model, n = 8 ID8-WT, n = 5 ID8-C3, n = 10 ID8-p53−/−, and n = 5 ID8-p53−/−Brca2−/−. F, Survival Kaplan–Meier plots of FVB/N-derived ovarian cancer cell lines, treated with syngeneic cellular vaccines (irradiated at 60 Gy) as in E. Curves represent mice as follows: n = 4–10 PBS for each model, n = 4 STOSE, n = 4 MOE-PTEN/KRAS, n = 10 MOE-PTEN/P53. Log-rank (Mantel–Cox; a, P < 0.05; b, P < 0.01).
FIGURE 3
FIGURE 3
ID8-C3 and ID8-p53−/− tumors recruit more T cells, while STOSE and MOE-PTEN/KRAS are more infiltrated by TAMs. A, Heatmap depicts normalized relative frequency of all the studied immune cell populations for all tumor models, determined by flow cytometry. White square is an omitted outlier sample. B, Pie charts showing relative distribution of main immune cell populations within each tumor type based on frequency (%) in CD45+ cell population. Other includes CD11bCD11c and CD11b+F480 populations. C, Percentage of CD3+ cells in leukocytes found in orthotopic tumor models as assessed by flow cytometry. Total frequency among leukocytes of CD11b+Gr1 (D) and MDSCs (E). F, IHC detection of CD3+ cells in tumors showing CD3 stained clusters in MOE-PTEN/KRAS samples. See Supplementary Fig. S6A–S6C for quantification of cells/mm2 and cluster representation at a lower magnification. G, Representative images showing CD11b+ cells for all tumor models. Sections were counterstained with hematoxylin (blue) and positive cells (brown) were stained with DAB. Scale bars, 50 μm. See Supplementary Fig. S7B for quantification of cells/mm2. H, Frequencies of CD206 TAMs and CD206+ M2 TAMs as well as CD11bCD11c+ and CD11b+CD11c+ DCs as determined by flow cytometry (I). For flow cytometry analysis, cell frequencies were determined by discriminating doublets, dead cells, and CD3+/− cells (see Supplementary Fig. S5). Each dot represents an orthotopic tumor. Mean values with SD are shown. Significance was determined by one-way ANOVA with Tukey post test comparing all models; ns, not significant; a, P < 0.05; b, P < 0.01; c, P < 0.001; d, P < 0.0001.
FIGURE 4
FIGURE 4
STOSE tumors have greater frequency of CD4 and CD8 T cells expressing exhaustion markers. Flow cytometry analysis showing the frequencies of CD4+-expressing cells (A) and CD25, PD-1, and LAG3 expression (B) among CD4+ T cells. C, Images representative of FOXP3+ staining in ID8-WT (n = 8), ID8-C3 (n = 6), ID8-p53−/− (n = 9), STOSE (n = 12), MOE-PTEN/KRAS (n = 6), and MOE-PTEN/p53 (n = 6) samples. Cell counts (plotted as number of cells/mm2) were quantified using ImagePro Premier. D and E, Flow cytometry analysis showing the frequencies of CD8+ T cells (D) among leukocytes in each tumor model and CD25 (E), PD-1 and LAG3 expression among CD8+ T cells. For flow cytometry analysis, cell frequencies were determined by discriminating doublets, dead cells, CD45, and CD3+ cells (see Supplementary Fig. S5A). Each dot represents an orthotopic tumor. Mean values with SD are shown. Significance was determined by one-way ANOVA with Tukey post test comparing all models; a, P < 0.05; b, P < 0.01; c, P < 0.001; d, P < 0.0001. F, Quantification (left) and IHC detection of endothelial cells by CD31 staining (right) in all tumor models. Data was quantified using Orbit Image analysis (% positive area). Each dot represents an orthotopic tumor. Mean values with SD are shown. Scale bars, 20 μm (FOXP3) and 50 μm (CD31). For IHC, sections were counterstained with hematoxylin (blue) and positive cells (brown) with DAB. Mean values with SD are shown. Significance was determined by one-way ANOVA within C57BL/6 or FVB/N models with Tukey post test or a two-tailed Student t test (comparing ID8 and STOSE); a, P < 0.05; d, P < 0.0001.
FIGURE 5
FIGURE 5
Primary and metastatic tumors from ID8-derived cancer cells do not express MHC-I in vivo, while STOSE and MOE models do. A, Immunofluorescence depicting MHC-I (green) and nuclei (Hoechst) on primary (top) and metastatic (bottom) tumors showing little to no expression of MHC-I. C57BL/6 spleen was used as a positive control. Images are representative of n = 3 primary/metastasis for each model. Scale bars, 50 μm. B, Primary and metastatic tumors derived from the FVB/N models retained MHC-I expression (green) as shown by immunofluorescence. Scale bars, 50 μm.
FIGURE 6
FIGURE 6
The TME of FVB/N models is characterized by strong MHC-II expression. A, IHC detection (right) and quantification of MHC-II+ cells (left) in all tumor models. Sections were counterstained with hematoxylin (blue) and positive cells with DAB (brown). Images are representative of tumors for each model as follows: ID8-WT (n = 10), ID8-C3 (n = 6), ID8-p53−/− (n = 9), STOSE (n = 10), MOE-PTEN/KRAS (n = 6), MOE-PTEN/p53 (n = 6) samples. Scale bars, 50 μm. Percent positive MHC-II (%) areas of the tumor were quantified using Orbit Image analysis. B, Immunofluorescence depicting MHC-II (green), Cytokeratin 8+18 (red), and nuclei (Hoechst) on primary tumors. Images are representative of n = 3 primary tumors for each model. Scale bars, 50 μm. C and D, MHC-II and PD-L1 expression in TAMs (C) and CD11b+CD11c+ (D) subsets found in the TME, assessed by flow cytometry. Mean values with SEM are shown for each tumor model. Significance was determined by one-way ANOVA with Tukey post test comparing all models; ns, not significant; a, P < 0.05; b, P < 0.01; c, P < 0.001; d, P < 0.0001. E, Quantification (right) and IHC detection (left) of PD-L1 expression in all tumor models. Sections were counterstained with hematoxylin (blue) and positive cells with DAB (brown). Images are representative of ID8-WT (n = 9), ID8-C3 (n = 6), ID8-p53−/− (n = 9), STOSE (n = 12), MOE-PTEN/KRAS (n = 6), MOE-PTEN/p53 (n = 6) tumors. Scale bars, 50 μm. Percent positive PD-L1 (%) areas of the tumor were quantified using Orbit Image analysis. Mean values with SD are shown for each tumor model. Significance was determined by one-way ANOVA within C57BL/6 or FVB/N models with Tukey post test or a two-tailed Student t test (comparing ID8 and STOSE).
FIGURE 7
FIGURE 7
The ascites immune composition and chemo/cytokine network highlights the heterogeneity of the murine orthotopic ovarian cancer models. A, Stacked-bar figures showing the relative frequencies of several immune populations found in the ascites. B, Significantly different frequencies of the myeloid-like compartment present in the ascites assessed by flow cytometry. Age-matched tumor-naive C57BL/6 and FVB/N mice were included as controls. Cells were analyzed as shown in Supplementary Fig. S5A. Each dot represents a single sample derived from an orthotopic tumor-bearing or control mouse. Mean values with SEM are shown for each tumor model. Significance was determined by one-way ANOVA with Tukey post test comparing all models; ns, not significant; a, P < 0.05; b, P < 0.01; c, P < 0.001; d, P < 0.0001. C, Stacked-bar figures showing the relative abundance of cytokines and chemokines found in the ascites fluid derived from orthotopic tumor-bearing mice. ID8-WT (n = 7), ID8-C3 (n = 3), ID8-p53−/− (n = 7), STOSE (n = 4), MOE-PTEN/KRAS (n = 7), MOE-PTEN/p53 (n = 2). IL10 (D) and VEGF abundance (E; pg/mL) in the ascites fluid of each tumor model. Chemo/cytokines were measured by LEGENDplex Mouse Cytokine Release Syndrome Panel (13-plex) Multi-Analyte Flow Assay. Each dot represents a single sample derived from the supernatant of ascites from tumor-bearing mice. Mean values with SD are shown for each tumor model. Significance was determined by one-way ANOVA with Tukey post test comparing all models; a, P < 0.05; b, P < 0.01; d, P < 0.0001.

Similar articles

Cited by

References

    1. American Cancer Society. Cancer Facts & Figures; 2021 | American Cancer Society [Internet]. Available from: https://www.cancer.org/research/cancer-facts-statistics/all-cancer-facts...
    1. Berek JS, Hacker NF. Berek and Hacker's gynecologic oncology. 6th ed.Philadelphia, PA: Lippincott Williams & Wilkins; 2015.
    1. Santoiemma PP, Reyes C, Wang L-P, Mclane MW, Feldman MD, Tanyi JL, et al. . Systematic evaluation of multiple immune markers reveals prognostic factors in ovarian cancer. Gynecol Oncol 2016;143:120–7. - PubMed
    1. Preston CC, Maurer MJ, Oberg AL, Visscher DW, Kalli KR, Hartmann LC, et al. . The ratios of CD8+ T cells to CD4+CD25+ FOXP3+ and FOXP3- T cells correlate with poor clinical outcome in human serous ovarian cancer. PLoS One 2013;8:e80063. - PMC - PubMed
    1. Callahan MJ, Nagymanyoki Z, Bonome T, Johnson ME, Litkouhi B, Sullivan EH, et al. . Increased HLA-DMB expression in the tumor epithelium is associated with increased CTL infiltration and improved prognosis in advanced-stage serous ovarian cancer. Clin Cancer Res 2008;14:7667–73. - PMC - PubMed

Publication types

Substances