Tracking matricellular protein SPARC in extracellular vesicles as a non-destructive method to evaluate lipid-based antifibrotic treatments
- PMID: 36310239
- PMCID: PMC9618575
- DOI: 10.1038/s42003-022-04123-z
Tracking matricellular protein SPARC in extracellular vesicles as a non-destructive method to evaluate lipid-based antifibrotic treatments
Abstract
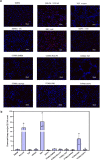
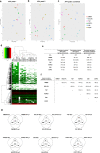
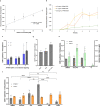
Uncovering the complex cellular mechanisms underlying hepatic fibrogenesis could expedite the development of effective treatments and noninvasive diagnosis for liver fibrosis. The biochemical complexity of extracellular vesicles (EVs) and their role in intercellular communication make them an attractive tool to look for biomarkers as potential alternative to liver biopsies. We developed a solid set of methods to isolate and characterize EVs from differently treated human hepatic stellate cell (HSC) line LX-2, and we investigated their biological effect onto naïve LX-2, proving that EVs do play an active role in fibrogenesis. We mined our proteomic data for EV-associated proteins whose expression correlated with HSC treatment, choosing the matricellular protein SPARC as proof-of-concept for the feasibility of fluorescence nanoparticle-tracking analysis to determine an EV-based HSCs' fibrogenic phenotype. We thus used EVs to directly evaluate the efficacy of treatment with S80, a polyenylphosphatidylcholines-rich lipid, finding that S80 reduces the relative presence of SPARC-positive EVs. Here we correlated the cellular response to lipid-based antifibrotic treatment to the relative presence of a candidate protein marker associated with the released EVs. Along with providing insights into polyenylphosphatidylcholines treatments, our findings pave the way for precise and less invasive diagnostic analyses of hepatic fibrogenesis.
© 2022. The Author(s).
Conflict of interest statement
No private study sponsors had any involvement in the study design, data collection, or interpretation of data presented in this manuscript. P.L. declares the following competing interests: she has consulted Lipoid GmbH and Sanofi-Aventis Deutschland and received research grants from Lipoid, Sanofi-Aventis Deutschland and DSM Nutritional Products Ltd. C.Z., K.F., and G.F. declare no competing interests.
Figures


Similar articles
-
Formulating elafibranor and obeticholic acid with phospholipids decreases drug-induced association of SPARC to extracellular vesicles from LX-2 human hepatic stellate cells.Eur J Pharm Biopharm. 2023 Jan;182:32-40. doi: 10.1016/j.ejpb.2022.11.025. Epub 2022 Dec 2. Eur J Pharm Biopharm. 2023. PMID: 36470521
-
Dynamic Changes in Function and Proteomic Composition of Extracellular Vesicles from Hepatic Stellate Cells during Cellular Activation.Cells. 2020 Jan 25;9(2):290. doi: 10.3390/cells9020290. Cells. 2020. PMID: 31991791 Free PMC article.
-
Hepatic stellate cell autophagy inhibits extracellular vesicle release to attenuate liver fibrosis.J Hepatol. 2020 Nov;73(5):1144-1154. doi: 10.1016/j.jhep.2020.04.044. Epub 2020 May 8. J Hepatol. 2020. PMID: 32389810 Free PMC article.
-
[Research progress of extracellular vesicles in hepatic fibrosis].Zhonghua Gan Zang Bing Za Zhi. 2019 Jun 20;27(6):407-410. doi: 10.3760/cma.j.issn.1007-3418.2019.06.003. Zhonghua Gan Zang Bing Za Zhi. 2019. PMID: 31357753 Review. Chinese.
-
Extracellular Vesicles as Biomarkers in Liver Disease.Int J Mol Sci. 2022 Dec 19;23(24):16217. doi: 10.3390/ijms232416217. Int J Mol Sci. 2022. PMID: 36555854 Free PMC article. Review.
Cited by
-
Formation and Investigation of Cell-Derived Nanovesicles as Potential Therapeutics against Chronic Liver Disease.Adv Healthc Mater. 2023 Dec;12(30):e2300811. doi: 10.1002/adhm.202300811. Epub 2023 Sep 17. Adv Healthc Mater. 2023. PMID: 37669775 Free PMC article.
References
Publication types
MeSH terms
Substances
LinkOut - more resources
Full Text Sources
Miscellaneous

