. 2022 Oct 30;13(1):6494.
doi: 10.1038/s41467-022-34277-7.

Deep transfer learning of cancer drug responses by integrating bulk and single-cell RNA-seq data

Affiliations

Deep transfer learning of cancer drug responses by integrating bulk and single-cell RNA-seq data

Junyi Chen et al. Nat Commun. .

Abstract

Drug screening data from massive bulk gene expression databases can be analyzed to determine the optimal clinical application of cancer drugs. The growing amount of single-cell RNA sequencing (scRNA-seq) data also provides insights into improving therapeutic effectiveness by helping to study the heterogeneity of drug responses for cancer cell subpopulations. Developing computational approaches to predict and interpret cancer drug response in single-cell data collected from clinical samples can be very useful. We propose scDEAL, a deep transfer learning framework for cancer drug response prediction at the single-cell level by integrating large-scale bulk cell-line data. The highlight in scDEAL involves harmonizing drug-related bulk RNA-seq data with scRNA-seq data and transferring the model trained on bulk RNA-seq data to predict drug responses in scRNA-seq. Another feature of scDEAL is the integrated gradient feature interpretation to infer the signature genes of drug resistance mechanisms. We benchmark scDEAL on six scRNA-seq datasets and demonstrate its model interpretability via three case studies focusing on drug response label prediction, gene signature identification, and pseudotime analysis. We believe that scDEAL could help study cell reprogramming, drug selection, and repurposing for improving therapeutic efficacy.


Conflict of interest statement

The authors declare no competing interests.

Figures
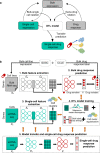
Fig. 1
Fig. 1. The scDEAL framework.
a scDEAL trains the model to align two relations: (i) bulk–single-cell relations and (ii) gene–drug response relations at the bulk level. The trained model will then be transferred to be directly applied to the scRNA-seq data and to predict the single-cell drug responses. Green-colored elements represent single-cell related data, and grey-colored elements represent bulk-related data. Different colors of cells represent different cell types. b Bulk RNA-seq data and the corresponding drug response labels are obtained from the GDSC and CCLE databases. Five steps are then applied. A DAE is used to induce noises into the bulk data. It uses an encoder (Eb) and a decoder (Db) to obtain low-dimensional features. The bulk feature ⨯ cell-line matrix is then input to a fully connected predictor (P) to predict cell-line drug responses. A similar strategy is used for single-cell feature election using a separated DAE (Es and Ds). The overall framework will be trained by considering the maximum mean discrepancy between the low-dimensional feature spaces of single-cell and bulk data, the cross-entropy loss between predicted bulk cell-line drug responses and ground-truth labels, and the regularization of cell clusters predicted from scRNA-seq data. By achieving the minimum overall loss, Eb, Es, and P will be updated and optimized simultaneously. scDEAL transfers the well-trained Es and P to predict single-cell drug responses from the scRNA-seq data. Abbreviations: deep transfer learning (DTL), Genomics of Drug Sensitivity in Cancer (GDSC), Cancer Cell Line Encyclopedia CCLE.
Fig. 2
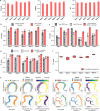
Fig. 2. Benchmarking results of scDEAL.
a Optimized benchmarking results of all six datasets using scDEAL. Source data are provided as Source Data 1: optimized benchmarking results of seven metrics. b F1-score comparison using GDSC database only, CCLE database only, and both databases in training scDEAL for all six datasets. The bar plot shows the mean F1-scores of each data (n = 50; same parameter settings for each data; different seeds), with error bars representing +/− standard deviations. The same rules are also applied for the bar plots in c and d. Source data are provided as Source Data 2: F1-score of 50 repeated experiments comparing with and without transfer learning in six datasets. c Drug response prediction comparisons of scDEAL framework using common autoencoder (dark grey), denoising autoencoder (light grey), and the combination of denoising autoencoder in feature extraction and cell-type regularization in DaNN loss function for transfer learning (pink). Source data are provided as Source Data 3: F1-score of 50 repeated experiments comparing use GDSC, use CCLE, and use both bulk databases in six datasets. d Comparisons of scDEAL with (grey) and without (pink) transfer learning in terms of F1-scores. Source data are provided as Source Data 4: F1-score of 50 repeated experiments comparing use autoencoder, denoise autoencoder, and combination of denoise autoencoder and cell type regularization in six datasets. e Latent representations of scDEAL obtained with/without cell type regularization for Data 5 and 6. f Robustness test on six scRNA-seq datasets via 80% stratified sampling in terms of F1-score. Each box shows the minimum, first quartile, median, third quartile, and maximum F1-scores of 20 samplings (n = 20). Dots represent outliers. Source data are provided as Source Data 6: F1-scoreof 80% stratified sampling of 20 repeats on six datasets. Abbreviations: Genomics of Drug Sensitivity in Cancer (GDSC), Cancer Cell Line Encyclopedia (CCLE), denoising autoencoder (DAE).
Fig. 3
Fig. 3. Case study of Data 6 corresponding to I-BET treatment.
a From left to right: UMAPS visualizations of Data 6 colored by sample treatment types provided in the original study, ground-truth drug-response labels, predicted binary drug response labels, and predicted continuous drug response probability scores. b UMAP plot colored by sensitive (and resistant) gene scores derived from differentially expressed genes in the predicted and ground-truth sensitive (and resistant) cluster. Source data are provided as Source Data 7: sensitive and resistant DEG scores in predicted and ground truth sensitive and resistance cells in Data 6. c The plot displays the one-tail Pearson’s correlation test between the gene scores derived from the predicted and the ground-truth cell labels (n = 1,404). The error bands showed a 95% confidence interval of the regression. Source data are provided as Source Data 7: sensitive and resistant DEG scores in predicted and ground truth sensitive and resistance cells in Data 6. d Empirical test (n = 1,000) of correlation coefficient. The x-axis represents empirical correlations of differentially expressed gene scores, the y-axis represents frequencies, and the red dashed line represents scDEAL results. Abbreviation: differentially expressed gene (DEG).
Fig. 4
Fig. 4. Case study of scDEAL on Data 1 with Cisplatin drug responses.
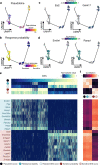
a UMAP comparison between ground-truth labels and predicted binary response labels in scDEAL. b Integrated gradient heatmap of top 50 CGs in the HN120P cell group (sensitive) and HN120PCR (resistant) cell group. CGs in HN120P were considered as sensitive CGs, and CGs in HN120PCR were considered as resistant CGs. c Cell fraction and normalized expression levels of the top ten CGs in HN120P and HN120PCR cell groups. Abbreviation: integrated gradient score (IG), critical genes (CGs).
Fig. 5
Fig. 5. Validating predicted drug response with pseudotime trajectory.
a Cell UMAP plot colored as per pseudotime scores predicted from the raw scRNA-seq data (Data 6). b Same UMAP plot colored as per predicted continuous drug response probability scores in scDEAL. c, d Diffusion UMAP colored by gene expressions of two representative genes in the predicted sensitive CG list and resistant CG list, respectively. e, f DEG scores in the sensitive and resistant cell groups, respectively, Pearson’s correlations between diffusion pseudotime value, sensitive and resistant response probability. Source data are provided as Source Data 9: Pseudotime score, resistant probability, resistant score, sensitive probability, and sensitive score for each cell; Source Data 10: Pearson’s correlations among pseudotime score, resistant probability, resistant score, sensitive probability, sensitive score, top 10 sensitive CGs, and the top 10 resistant CGs. Abbreviation: differentially expressed gene (DEG).

Similar articles

Cited by

References

    1. Verjans ET, Doijen J, Luyten W, Landuyt B, Schoofs L. Three‐dimensional cell culture models for anticancer drug screening: Worth the effort? J. Cell. Physiol. 2018;233:2993–3003. doi: 10.1002/jcp.26052. - DOI - PubMed
    1. Schirle M, Jenkins JL. Identifying compound efficacy targets in phenotypic drug discovery. Drug Discovery Today. 2016;21:82–89. doi: 10.1016/j.drudis.2015.08.001. - DOI - PubMed
    1. Wong CH, Siah KW, Lo AW. Estimation of clinical trial success rates and related parameters. Biostatistics. 2019;20:273–286. doi: 10.1093/biostatistics/kxx069. - DOI - PMC - PubMed
    1. Rambow F, et al. Toward Minimal Residual Disease-Directed Therapy in Melanoma. Cell. 2018;174:843–855 e819. doi: 10.1016/j.cell.2018.06.025. - DOI - PubMed
    1. Wang J, et al. scGNN is a novel graph neural network framework for single-cell RNA-Seq analyses. Nat. Commun. 2021;12:1882. doi: 10.1038/s41467-021-22197-x. - DOI - PMC - PubMed

Publication types

Substances