Genome-Wide CRISPR/Cas9 Library Screening Revealed Dietary Restriction of Glutamine in Combination with Inhibition of Pyruvate Metabolism as Effective Liver Cancer Treatment
- PMID: 36310121
- PMCID: PMC9731711
- DOI: 10.1002/advs.202202104
Genome-Wide CRISPR/Cas9 Library Screening Revealed Dietary Restriction of Glutamine in Combination with Inhibition of Pyruvate Metabolism as Effective Liver Cancer Treatment
Abstract
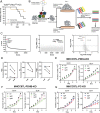
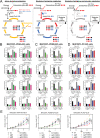
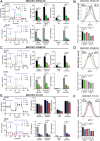
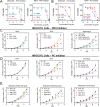
Hepatocellular carcinoma (HCC) is the second most lethal cancer worldwide. Glutamine is an essential, extracellular nutrient which supports HCC growth. Dietary glutamine deficiency may be a potential therapeutic approach for HCC. HCC cells overcome metabolic challenges by rewiring their metabolic pathways for rapid adaptations. The efficiency of dietary glutamine deficiency as HCC treatment is examined and the adaptation machinery under glutamine depletion in HCC cells is unraveled. Using genome-wide CRISPR/Cas9 knockout library screening, this study identifies that pyruvate dehydrogenase α (PDHA), pyruvate dehydrogenase β (PDHB), and pyruvate carboxylase (PC) in pyruvate metabolism are crucial to the adaptation of glutamine depletion in HCC cells. Knockout of either PDHA, PDHB or PC induced metabolic reprogramming of the tricarboxylic acid (TCA) cycle, disrupts mitochondrial function, leading to the suppression of HCC cell proliferation under glutamine depletion. Surprisingly, dietary glutamine restriction improves therapeutic responses of HCC to PDH or PC inhibitor in mouse HCC models. Stable isotope carbon tracing confirms that PDH or PC inhibitors further disrupt the metabolic rewiring of the TCA cycle induced by dietary glutamine depletion in HCC. In summary, the results demonstrate that pyruvate metabolism acts as novel targetable metabolic vulnerabilities for HCC treatment in combination with a glutamine-deficient diet.
Keywords: CRISPR/Cas9 library screening; dietary intervention; glutamine depletion; hepatocellular carcinoma; pyruvate metabolism.
© 2022 The Authors. Advanced Science published by Wiley-VCH GmbH.
Conflict of interest statement
The authors declare no conflict of interest.
Figures


Similar articles
-
Disrupting Mitochondrial Pyruvate Uptake Directs Glutamine into the TCA Cycle away from Glutathione Synthesis and Impairs Hepatocellular Tumorigenesis.Cell Rep. 2019 Sep 3;28(10):2608-2619.e6. doi: 10.1016/j.celrep.2019.07.098. Cell Rep. 2019. PMID: 31484072 Free PMC article.
-
OGDHL silencing promotes hepatocellular carcinoma by reprogramming glutamine metabolism.J Hepatol. 2020 May;72(5):909-923. doi: 10.1016/j.jhep.2019.12.015. Epub 2019 Dec 30. J Hepatol. 2020. PMID: 31899205
-
Metabolic and oncogenic adaptations to pyruvate dehydrogenase inactivation in fibroblasts.J Biol Chem. 2019 Apr 5;294(14):5466-5486. doi: 10.1074/jbc.RA118.005200. Epub 2019 Feb 12. J Biol Chem. 2019. PMID: 30755479 Free PMC article.
-
A review of the literature on the use of CRISPR/Cas9 gene therapy to treat hepatocellular carcinoma.Oncol Res. 2024 Feb 6;32(3):439-461. doi: 10.32604/or.2023.044473. eCollection 2024. Oncol Res. 2024. PMID: 38361756 Free PMC article. Review.
-
Metabolic dysregulation and emerging therapeutical targets for hepatocellular carcinoma.Acta Pharm Sin B. 2022 Feb;12(2):558-580. doi: 10.1016/j.apsb.2021.09.019. Epub 2021 Sep 25. Acta Pharm Sin B. 2022. PMID: 35256934 Free PMC article. Review.
Cited by
-
Genome-wide loss-of-function genetic screen identifies INSIG2 as the vulnerability of hepatitis B virus-integrated hepatoma cells.Cancer Sci. 2024 Mar;115(3):859-870. doi: 10.1111/cas.16070. Epub 2024 Jan 29. Cancer Sci. 2024. PMID: 38287498 Free PMC article.
-
CRISPR-Cas and CRISPR-based screening system for precise gene editing and targeted cancer therapy.J Transl Med. 2024 May 30;22(1):516. doi: 10.1186/s12967-024-05235-2. J Transl Med. 2024. PMID: 38816739 Free PMC article. Review.
-
tRF-1:30-Gly-CCC-3 inhibits thyroid cancer via binding to PC and modulating metabolic reprogramming.Life Sci Alliance. 2023 Dec 11;7(3):e202302285. doi: 10.26508/lsa.202302285. Print 2024 Mar. Life Sci Alliance. 2023. PMID: 38081642 Free PMC article.
-
Analysis of the potential biological value of pyruvate dehydrogenase E1 subunit β in human cancer.World J Gastrointest Oncol. 2024 Jan 15;16(1):144-181. doi: 10.4251/wjgo.v16.i1.144. World J Gastrointest Oncol. 2024. PMID: 38292838 Free PMC article.
-
Novel cuproptosis-related prognostic gene profiles in preeclampsia.BMC Pregnancy Childbirth. 2024 Jan 10;24(1):53. doi: 10.1186/s12884-023-06215-y. BMC Pregnancy Childbirth. 2024. PMID: 38200445 Free PMC article.
References
-
- Llovet J. M., Kelley R. K., Villanueva A., Singal A. G., Pikarsky E., Roayaie S., Lencioni R., Koike K., Zucman‐Rossi J., Finn R. S., Nat. Rev. Dis. Primers 2021, 7, 6. - PubMed
-
- Llovet J. M., Montal R., Sia D., Finn R. S., Nat. Rev. Clin. Oncol. 2018, 15, 599. - PubMed
-
- Finn R. S., Qin S., Ikeda M., Galle P. R., Ducreux M., Kim T.‐Y., Kudo M., Breder V., Merle P., Kaseb A. O., Li D., Verret W., Xu D.‐Z., Hernandez S., Liu J., Huang C., Mulla S., Wang Y., Lim H. Y., Zhu A. X., Cheng A.‐L., N. Engl. J. Med. 2020, 382, 1894. - PubMed
-
- DeBerardinis R. J., Lum J. J., Hatzivassiliou G., Thompson C. B., Cell Metab. 2008, 7, 11. - PubMed
Publication types
MeSH terms
Substances
Grants and funding
LinkOut - more resources
Full Text Sources
Medical
