

Navigating Transcriptomic Connectivity Mapping Workflows to Link Chemicals with Bioactivities
- PMID: 36301716
- PMCID: PMC10483698
- DOI: 10.1021/acs.chemrestox.2c00245
Navigating Transcriptomic Connectivity Mapping Workflows to Link Chemicals with Bioactivities
Abstract
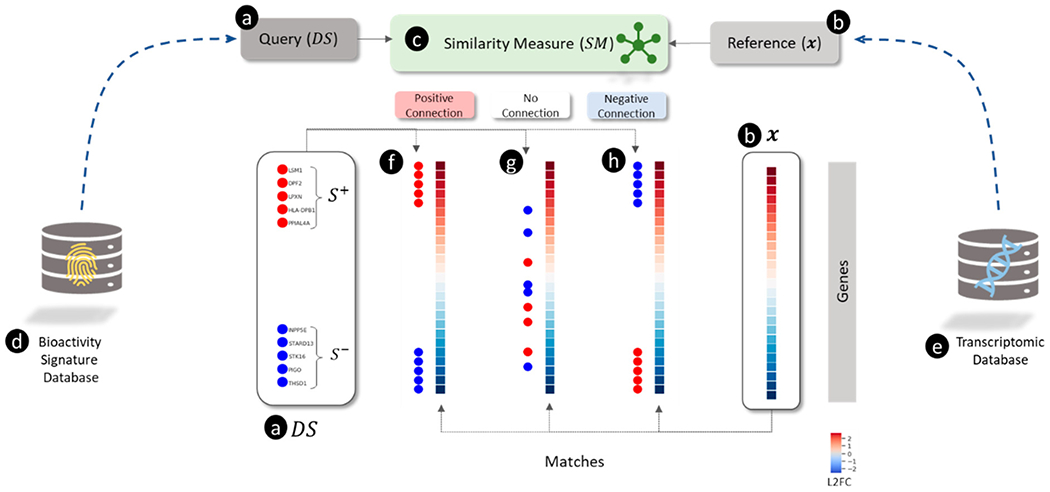
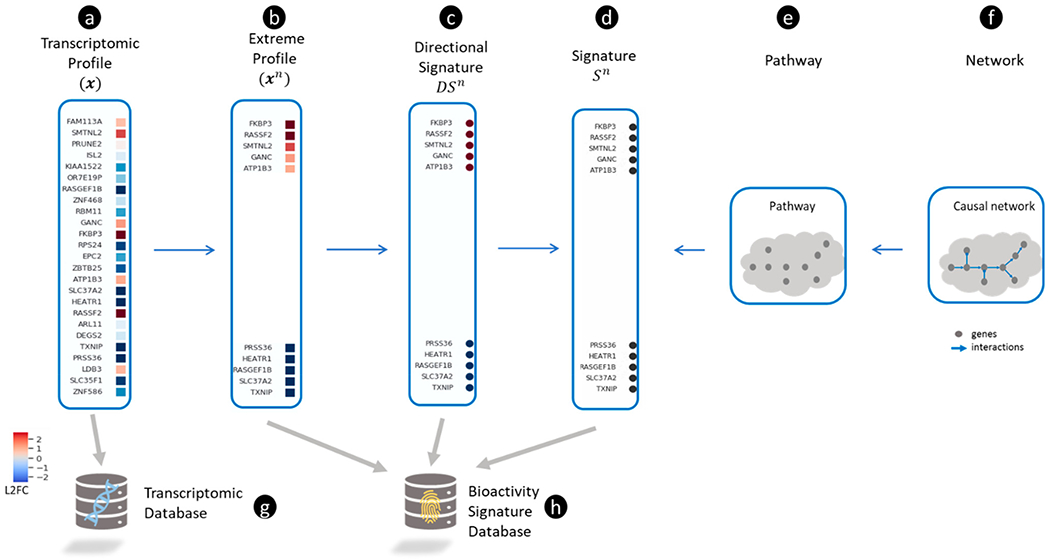
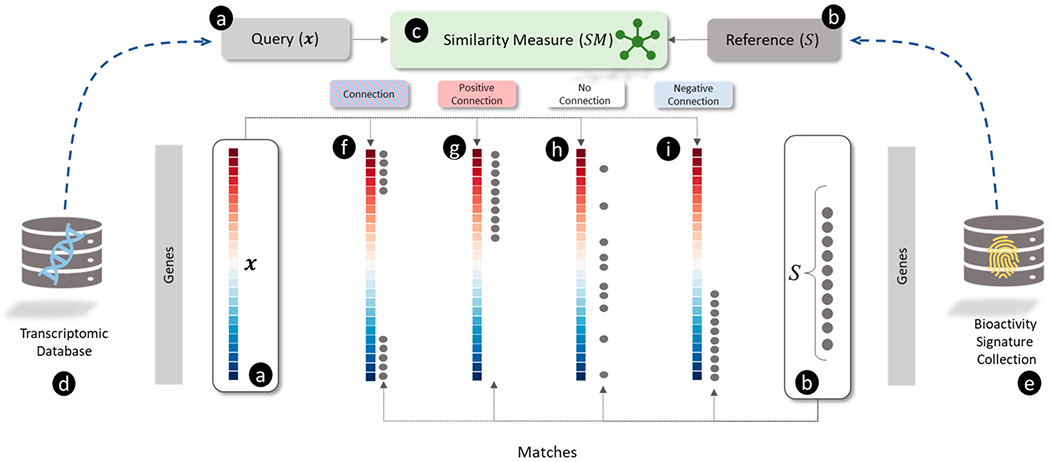
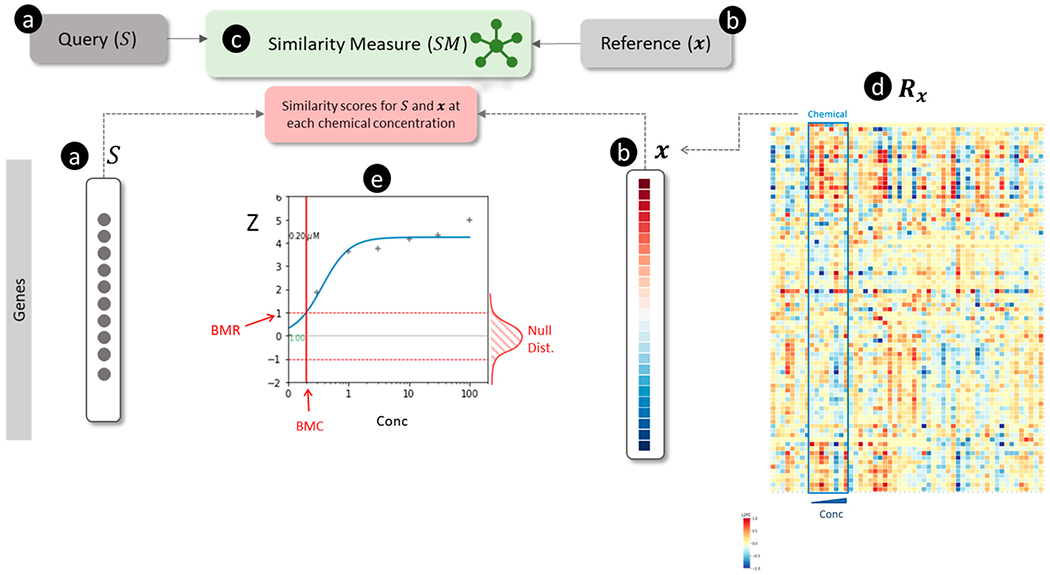
Screening new compounds for potential bioactivities against cellular targets is vital for drug discovery and chemical safety. Transcriptomics offers an efficient approach for assessing global gene expression changes, but interpreting chemical mechanisms from these data is often challenging. Connectivity mapping is a potential data-driven avenue for linking chemicals to mechanisms based on the observation that many biological processes are associated with unique gene expression signatures (gene signatures). However, mining the effects of a chemical on gene signatures for biological mechanisms is challenging because transcriptomic data contain thousands of noisy genes. New connectivity mapping approaches seeking to distinguish signal from noise continue to be developed, spurred by the promise of discovering chemical mechanisms, new drugs, and disease targets from burgeoning transcriptomic data. Here, we analyze these approaches in terms of diverse transcriptomic technologies, public databases, gene signatures, pattern-matching algorithms, and statistical evaluation criteria. To navigate the complexity of connectivity mapping, we propose a harmonized scheme to coherently organize and compare published workflows. We first standardize concepts underlying transcriptomic profiles and gene signatures based on various transcriptomic technologies such as microarrays, RNA-Seq, and L1000 and discuss the widely used data sources such as Gene Expression Omnibus, ArrayExpress, and MSigDB. Next, we generalize connectivity mapping as a pattern-matching task for finding similarity between a query (e.g., transcriptomic profile for new chemical) and a reference (e.g., gene signature of known target). Published pattern-matching approaches fall into two main categories: vector-based use metrics like correlation, Jaccard index, etc., and aggregation-based use parametric and nonparametric statistics (e.g., gene set enrichment analysis). The statistical methods for evaluating the performance of different approaches are described, along with comparisons reported in the literature on benchmark transcriptomic data sets. Lastly, we review connectivity mapping applications in toxicology and offer guidance on evaluating chemical-induced toxicity with concentration-response transcriptomic data. In addition to serving as a high-level guide and tutorial for understanding and implementing connectivity mapping workflows, we hope this review will stimulate new algorithms for evaluating chemical safety and drug discovery using transcriptomic data.
Conflict of interest statement
Conflict of Interest
The authors declare no conflict of interest. This manuscript has been reviewed by the Center for Computational Toxicology and Exposure, Office of Research and Development, U.S. Environmental Protection Agency, and approved for publication. Approval does not signify that the contents reflect the views of the Agency, nor does mention of trade names or commercial products constitute endorsement or recommendation for use.
Figures
Similar articles
-
Transcriptomic Data Mining and Repurposing for Computational Drug Discovery.Methods Mol Biol. 2019;1903:73-95. doi: 10.1007/978-1-4939-8955-3_5. Methods Mol Biol. 2019. PMID: 30547437
-
A gene-signature progression approach to identifying candidate small-molecule cancer therapeutics with connectivity mapping.BMC Bioinformatics. 2016 May 11;17(1):211. doi: 10.1186/s12859-016-1066-x. BMC Bioinformatics. 2016. PMID: 27170106 Free PMC article.
-
A strategy to detect metabolic changes induced by exposure to chemicals from large sets of condition-specific metabolic models computed with enumeration techniques.BMC Bioinformatics. 2024 Jul 11;25(1):234. doi: 10.1186/s12859-024-05845-z. BMC Bioinformatics. 2024. PMID: 38992584 Free PMC article.
-
A computational framework to improve cross-platform implementation of transcriptomics signatures.EBioMedicine. 2024 Jul;105:105204. doi: 10.1016/j.ebiom.2024.105204. Epub 2024 Jun 19. EBioMedicine. 2024. PMID: 38901146 Free PMC article. Review.
-
Engineering Aspects of Olfaction.In: Persaud KC, Marco S, Gutiérrez-Gálvez A, editors. Neuromorphic Olfaction. Boca Raton (FL): CRC Press/Taylor & Francis; 2013. Chapter 1. In: Persaud KC, Marco S, Gutiérrez-Gálvez A, editors. Neuromorphic Olfaction. Boca Raton (FL): CRC Press/Taylor & Francis; 2013. Chapter 1. PMID: 26042329 Free Books & Documents. Review.
Cited by
-
Progress in toxicogenomics to protect human health.Nat Rev Genet. 2025 Feb;26(2):105-122. doi: 10.1038/s41576-024-00767-1. Epub 2024 Sep 2. Nat Rev Genet. 2025. PMID: 39223311 Review.
-
Computational pipeline predicting cell death suppressors as targets for cancer therapy.iScience. 2024 Aug 30;27(9):110859. doi: 10.1016/j.isci.2024.110859. eCollection 2024 Sep 20. iScience. 2024. PMID: 39310772 Free PMC article.
-
Searching for LINCS to Stress: Using Text Mining to Automate Reference Chemical Curation.Chem Res Toxicol. 2024 Jun 17;37(6):878-893. doi: 10.1021/acs.chemrestox.3c00335. Epub 2024 May 13. Chem Res Toxicol. 2024. PMID: 38736322
-
Comparison of transcriptomic profiles between HFPO-DA and prototypical PPARα, PPARγ, and cytotoxic agents in mouse, rat, and pooled human hepatocytes.Toxicol Sci. 2024 Jun 26;200(1):165-182. doi: 10.1093/toxsci/kfae044. Toxicol Sci. 2024. PMID: 38574381 Free PMC article.
-
Applying genomics in regulatory toxicology: a report of the ECETOC workshop on omics threshold on non-adversity.Arch Toxicol. 2023 Aug;97(8):2291-2302. doi: 10.1007/s00204-023-03522-3. Epub 2023 Jun 9. Arch Toxicol. 2023. PMID: 37296313 Free PMC article.
References
-
- Lamb J; Crawford ED; Peck D; Modell JW; Blat IC; Wrobel MJ; Lerner J; Brunet J-P; Subramanian A; Ross KN; Reich M; Hieronymus H; Wei G; Armstrong SA; Haggarty SJ; Clemons PA; Wei R; Carr SA; Lander ES; Golub TR The Connectivity Map: Using Gene-Expression Signatures to Connect Small Molecules, Genes, and Disease. Science 2006, 313 (5795), 1929–1935. 10.1126/science.1132939. - DOI - PubMed
Publication types
MeSH terms
Grants and funding
LinkOut - more resources
Full Text Sources
