. 2022 Oct 26;15(1):86.
doi: 10.1186/s13041-022-00970-3.

Spinal microglia contribute to sustained inflammatory pain via amplifying neuronal activity

Affiliations

Spinal microglia contribute to sustained inflammatory pain via amplifying neuronal activity

Nan Gu et al. Mol Brain. .

Abstract

Microglia are highly dynamic immune cells of the central nervous system (CNS). Microglial processes interact with neuronal elements constantly on the order of minutes. The functional significance of this acute microglia-neuron interaction and its potential role in the context of pain is still largely unknown. Here, we found that spinal microglia increased their process motility and electrophysiological reactivity within an hour after the insult in a mouse model of formalin-induced acute, sustained, inflammatory pain. Using an ablation strategy to specifically deplete resident microglia in the CNS, we demonstrate that microglia participate in formalin-induced acute sustained pain behaviors by amplifying neuronal activity in the spinal dorsal horn. Moreover, we identified that the P2Y12 receptor, which is specifically expressed in microglia in the CNS, was required for microglial function in formalin-induced pain. Taken together, our study provides a novel insight into the contribution of microglia and the P2Y12 receptor in inflammatory pain that could be used for potential therapeutic strategies.

Keywords: Formalin; Inflammatory pain; Microglia; Microglia–neuron interaction; P2Y12 receptor; Two-photon imaging.


Conflict of interest statement

The authors declare that they have no competing interests.

Figures
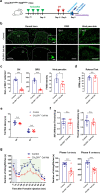
Fig. 1
Fig. 1
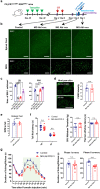
CX3CR1+ cell depletion reduces both formalin induced phase-I acute inflammatory pain and phase-II persistent inflammatory pain. a Schematic diagram showing the timeline of tamoxifen (TM) and diphtheria toxin (DT) administration, intraplantar injection of formalin (5% in PBS, 10 μl) or bradykinin (3 μg in PBS, 10 μl), behavioral tests (pain thresholds and rotarod test) and immunostaining in mice. b Iba1-positive cells were largely depleted 2 days after last DT injection in spinal cord dorsal horn (DH) and dorsal root ganglia (DRG). F4/80-positive macrophages in hind paw skin were also largely depleted at postoperative day (POD) 2 after the last DT injection, compared to the control group (mice without DT treatment). Left column, low magnification view of Iba1-positive cells in spinal cord DH of CX3CR1CreER/ +: R26iDTR/+ mice in control and CX3CR1+ cell ablation (Abl) mice. Inset: representative higher magnification images showing detailed microglia morphology. Scale bars represent 200 μm and 20 μm. Middle column, representative images of Iba1-positive cells in DRG in control and CX3CR1+ cell ablation mice. Scale bar, 100 μm. Right column, representative images of F4/80-positive macrophages in hind paw skin in control and CX3CR1+ cell ablation mice. Scale bar, 200 μm. c Quantitative data showing the density of Iba1-positive cells in the DH (***p < 0.001, unpaired 2-tailed Student’s t test, n = 8–12 mice/group), DRG (***p < 0.001, unpaired 2-tailed Student’s t test, n = 7–12 mice/group) and F4/80-positive cells in hind paw skin (*p < 0.05, unpaired 2-tailed Student’s t test, n = 5–7 mice/group) from control and CX3CR1+ cell ablation mice. Data are presented as mean ± SEM. df CX3CR1+ cell ablation does not affect acute pain responses and basal motor function. d Analysis of rotarod test in control and CX3CR1+ cell ablation mice showing that CX3CR1+ cell ablation did not affect basal motor function. (n = 6–7 mice/group). e, f Basal pain threshold for heat sensitivity (Tail immersion tests, Thermal Withdrawal Latency with Hargreaves Method) and mechanical sensitivity (Mechanical Withdrawal Threshold with von Frey tests) in control and CX3CR1+ cell ablation mice. Data are presented as mean ± SEM. n.s., no significance, unpaired 2-tailed Student’s t test, n = 8–9 mice/group. g, h Time course (0–60 min) of formalin-induced spontaneous pain behavior (licking/flinching) in control and CX3CR1+ cell ablation mice, as measured in every 5 min (g). Histogram representing formalin-induced Phase-I (1–10 min) and Phase-II inflammatory pain responses (10–60 min) in control and CX3CR1+ cell ablation mice. Both formalin-induced Phase-I and Phase-II inflammatory pain are reduced in CX3CR1+ cell depleted mice (h). Data are presented as mean ± SEM; *P < 0.05, **P < 0.01, ***P < 0.001, compared to control mice, unpaired 2-tailed Student’s t test, n = 9–11 mice/group
Fig. 2
Fig. 2
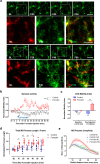
Depletion of peripheral macrophage reduces formalin induced phase-I acute inflammatory pain. a F4/80-positive cells were largely depleted in hind paw skin 2 days after clodronate liposome treatment (15 ml/kg, i.p.), while Iba1-positive cells in spinal cord DH and DRG were preserved. Representative images of Iba1-positive cells in DH and DRG and F4/80-positive macrophages in hind paw skin from the control and clodronate depletion mice. Scale bars represent 400 μm, 200 μm and 300 μm. b Quantitative data showing the density of Iba1-positive cells in DH, DRG (n.s., no significance, unpaired 2-tailed Student’s t test, n = 6–7 mice/group) and F4/80-positive cells in hind paw skin (***p < 0.001, unpaired 2-tailed Student’s t test, n = 5–6 mice/group) from control and clodronate (Clod.) depletion mice. Data are presented as mean ± SEM. c Basal pain threshold for heat sensitivity (Thermal Withdrawal Latency with Hargreaves Method) and mechanical sensitivity (Mechanical Withdrawal Threshold with von Frey tests) in control and clodronate depletion mice. n = 6 mice/group. Data are presented as mean ± SEM. d Time course (0–60 min) of formalin-induced spontaneous pain behavior (licking/flinching) in control and clodronate depletion mice, as measured every 5 min. Histogram representing formalin-induced Phase-I (1–10 min) and Phase-II (10–60 min) inflammatory pain responses in control and clodronate depletion mice. Note formalin-induced Phase-I acute inflammatory pain is reduced in clodronate depletion mice, while formalin-induced Phase-II inflammatory pain was not significantly affected. Data are presented as mean ± SEM, **P < 0.01, ***P < 0.001, compared to control mice; unpaired 2-tailed Student’s t test, n = 5–8 mice/group
Fig. 3
Fig. 3
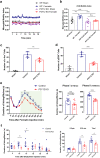
Ablation of resident microglia reduces formalin induced phase-II persistent inflammatory pain. a Schematic diagram showing the timeline of TM and DT administration, intraplantar injection of formalin (5% in PBS, 10 μl) or bradykinin (3 μg in PBS, 10 μl), behavioral tests (pain thresholds and rotarod test) and immunostaining in mice. Ablation or repopulation efficiency were checked at four time points before DT injection and days 2,3, 4 after the last DT injection. bd Iba1-positive resident macrophages in DRGs can also be ablated acutely along with resident microglia in the spinal cord. However, DRG macrophages repopulated faster than that of spinal microglia. The number of DRG macrophages reached control levels 3 days after last DT injection, while spinal microglia were still largely absent. F4/80-positive macrophages in hind paw skin remain preserved after TM and DT treatment. b Representative images of Iba1-positive cells in spinal cord and DRG before DT injection and 2,3, 4 days after last DT injection. Scale bar, 200 μm. c Quantitative data showing the density of Iba1-positive cells in the DH (***p < 0.001, unpaired 2-tailed Student’s t test, n = 6–12 mice/group) and DRG (***p < 0.001, unpaired 2-tailed Student’s t test, n = 6–8 mice/group) from control and microglia ablation (MG Abl) mice. Data are presented as mean ± SEM. d Representative images of F4/80-positive macrophages in hind paw skin in control and microglia ablation POD3 mice. Scale bar, 200 μm. Quantitative data showing the density of F4/80-positive macrophages in skin from control and microglia ablation mice. (n.s., unpaired 2-tailed Student’s t test, n = 5 mice/group). e Analysis of rotarod test in control and microglia ablation mice indicating that CNS microglia ablation did not affect basal motor function (n = 6 mice/group). f Basal pain threshold for heat sensitivity (Tail immersion tests, n = 6 mice/group; Thermal Withdrawal Latency with Hargreaves Method, n = 9 mice/group) and mechanical sensitivity (Mechanical Withdrawal Threshold with von Frey tests, n = 8 mice/group) in control and microglia ablation POD3 mice. Data are presented as mean ± SEM; n.s., unpaired 2-tailed Student’s t test. g Time course (0–60 min) of formalin-induced spontaneous pain behavior (licking/flinching) in control and microglia ablation mice, as measured every 5 min. Histogram representing formalin induced Phase-I (1–10 min) and Phase-II inflammatory pain responses (10–60 min) in control and microglia ablation mice. Formalin-induced Phase-II persistent inflammatory pain is reduced in microglia ablation mice at POD3, while formalin-induced Phase-I acute inflammatory pain was not affected. Data are presented as mean ± SEM; *P < 0.05, **P < 0.01, ***P < 0.001, compared to control mice; unpaired 2-tailed Student’s t test, n = 7–8 mice/group
Fig. 4
Fig. 4
Microglial process dynamics are enhanced during formalin induced phase-II persistent inflammatory pain. a Representative in vivo z-stack images of L4-5 ipsilateral spinal microglia from time-lapse imaging taken before (− 10 min, BL) and 20 (F20), 40 (F40), or 60 min (F60) after either intraplantar formalin injection (5% in PBS, 10 μl) or control injection (PBS). Higher magnification images from boxed regions of BL in red and F40 in green were merged in BL/F40 to show microglial process extension. Time lapse two-photon z-stack images were also taken from control mice at before (–10 min, BL) and 20 min (C20), 40 min (C40), 60 min (C60) after intraplantar saline injection. Higher magnification images from boxed regions of BL in red and C40 in green were merged in BL/C40. Note that there was no dramatic change in microglial process extension in control conditions. Scale bars represent 40 μm and 20 μm. b Quantitative data showing dynamics of spinal microglial processes, represented as normalized motility index, in control and formalin-treated groups. Data are shown as mean ± SEM. ***P < 0.001, compared to control. Two-way ANOVA. n = 5–6 mice/group (Control: n = 6, Formalin: n = 5). c Quantitative data showing average motility index of spinal microglial processes in control and formalin-treated group within different time windows (− 10 ~ 0 min before and 11 ~ 40 min after saline/formalin injection). Data are shown as mean ± SEM. **P < 0.01, compared to control. Unpaired 2-tailed Student’s t test. n = 6 for control and n = 5 for formalin-treated group. d Quantitative data showing spinal microglial process length, represented as normalized process length, in control and formalin-treated groups at different time points with respect to saline/formalin injection. Process lengths were analyzed every 10 min. Data are shown as mean ± SEM. *P < 0.05, **P < 0.01, compared to control. Unpaired 2-tailed Student’s t test. n = 6–7/group. e Sholl analysis plot representing microglia complexity in control and formalin-treated group. n = 7–13/group
Fig. 5
Fig. 5
Electrophysiological properties of microglia during formalin induced phase-II persistent inflammatory pain. a Representative traces showing whole cell recording of microglial currents in response to ramp from − 100 mV ~ + 80 mV (left) or depolarization steps from − 100 mV to 80 mV (right) in control and formalin-treated groups. b Quantified summaries of microglial current in response to depolarization steps from − 100 mV to 80 mV from control and formalin-treated mice. Holding potential: − 60 mV. n = 5 cells/group. Data are shown as mean ± SEM. *P < 0.05; **P < 0.01, compared to control
Fig. 6
Fig. 6
Reduced formalin-induced neuronal activity in the absence of microglia in the spinal cord. a, b Intraplantar injection of formalin induced c-fos expression and pERK activation co-localized with NeuN immunostaining. a Representative images showing double staining of c-fos+ or pERK+ (red) and NeuN+ (green) cells in the spinal cord DH either 2 h after formalin injection (c-fos staining) or 40 min after formalin injection (pERK staining). Scale bar, 100 mm. b Quantification of the percentage of c-fos+NeuN+ or pERK+NeuN+ cells among all c-fos+ or pERK+ cells. n = 4 mice/group. c, e Representative images of c-fos -positive (c) and pERK -positive (e) cells in ipsilateral dorsal horn from the sham, control (CTRL) and microglia ablation (MG Abl) POD3 mice. Scale bar, 200 μm. d, f Quantitative data showing the number of c-fos+ cells 2 h after intraplantar formalin injection (d) or pERK+ cells 40 min after intraplantar formalin injection (f) in the ipsilateral dorsal horn of WT sham, WT control and microglia ablation POD3 mice. Data are presented as mean ± SEM; ***P < 0.001, compared with control, unpaired 2-tailed Student’s t test, n = 5–8 mice/group
Fig. 7
Fig. 7
P2Y12 receptor in microglia dynamics, neuronal excitability and formalin induced phase-II persistent inflammatory pain. a, b Quantification of microglial motility indices at 40 min after intraplantar injection from WT and P2Y12 knockout (KO) spinal cord slices over a 20 min imaging session (a) or as the group average for each condition (b). Sham, intraplantar saline injection; Formalin, intraplantar formalin injection. Data are shown as mean ± SEM. **P < 0.01, ***P < 0.001, Two-way ANOVA with post hoc comparisons, n = 6–7 slices from 3 to 5 mice per group for slices images. c, d The number of c-fos+ cells and pERK+ cells were largely reduced in P2Y12 KO mice compared with wild-type mice after formalin injection in the ipsilateral dorsal horn from the WT sham, WT control and P2Y12 KO groups. Data are presented as mean ± SEM; **P < 0.01, ***P < 0.001, compared with WT Control, Two-way ANOVA with post hoc comparisons, n = 5–7 mice/group. e Time course (0–60 min) of formalin-induced spontaneous pain behavior (licking/flinching) in WT control and P2Y12 KO mice, as measured every 5 min. Histogram representing formalin-induced Phase-I (1–10 min) and Phase-II inflammatory pain responses (10–60 min) in WT control and P2Y12 KO mice. Note the formalin-induced Phase-II inflammatory pain is significantly reduced in P2Y12 KO mice. Data are presented as mean ± SEM; *P < 0.05, **P < 0.01, ***P < 0.001, compared to WT control mice, unpaired 2-tailed Student’s t test, n = 8–9 mice/group. f Time course (0–30 min) of bradykinin-induced spontaneous pain behavior (licking/flinching) in WT control and P2Y12 KO mice, as measured every 5 min. Histogram representing bradykinin-induced inflammatory pain responses within 0–5 min, 5–30 min and 0–30 min in WT control and P2Y12 KO mice. Bradykinin-induced inflammatory pain is reduced within 5–30 min and 0–30 min in P2Y12 KO mice. Data are presented as mean ± SEM; *P < 0.05, compared to WT control mice, Two-way ANOVA with post hoc comparisons, n = 5–8 mice/group

Similar articles

Cited by

References

    1. Wolf SA, Boddeke HW, Kettenmann H. Microglia in physiology and disease. Annu Rev Physiol. 2017;79:619–643. - PubMed
    1. Eyo UB, Wu LJ. Microglia: lifelong patrolling immune cells of the brain. Prog Neurobiol. 2019;179:101614. - PMC - PubMed
    1. Eyo UB, Peng J, Swiatkowski P, Mukherjee A, Bispo A, Wu LJ. Neuronal hyperactivity recruits microglial processes via neuronal NMDA receptors and microglial P2Y12 receptors after status epilepticus. J Neurosci. 2014;34(32):10528–10540. - PMC - PubMed
    1. Eyo UB, Gu N, De S, Dong H, Richardson JR, Wu LJ. Modulation of microglial process convergence towards neuronal dendrites by extracellular calcium. J Neurosci. 2015;35(6):2417–2422. - PMC - PubMed
    1. Gu N, Eyo UB, Murugan M, Peng J, Matta S, Dong H, Wu LJ. Microglial P2Y12 receptors regulate microglial activation and surveillance during neuropathic pain. Brain Behav Immun. 2016;55:82–92. - PMC - PubMed

Publication types

Substances

LinkOut - more resources