. 2022 Nov 17;29(11):1649-1660.e4.
doi: 10.1016/j.chembiol.2022.10.004. Epub 2022 Oct 24.

Multiplexed bioluminescence imaging with a substrate unmixing platform

Affiliations

Multiplexed bioluminescence imaging with a substrate unmixing platform

Caroline K Brennan et al. Cell Chem Biol. .

Abstract

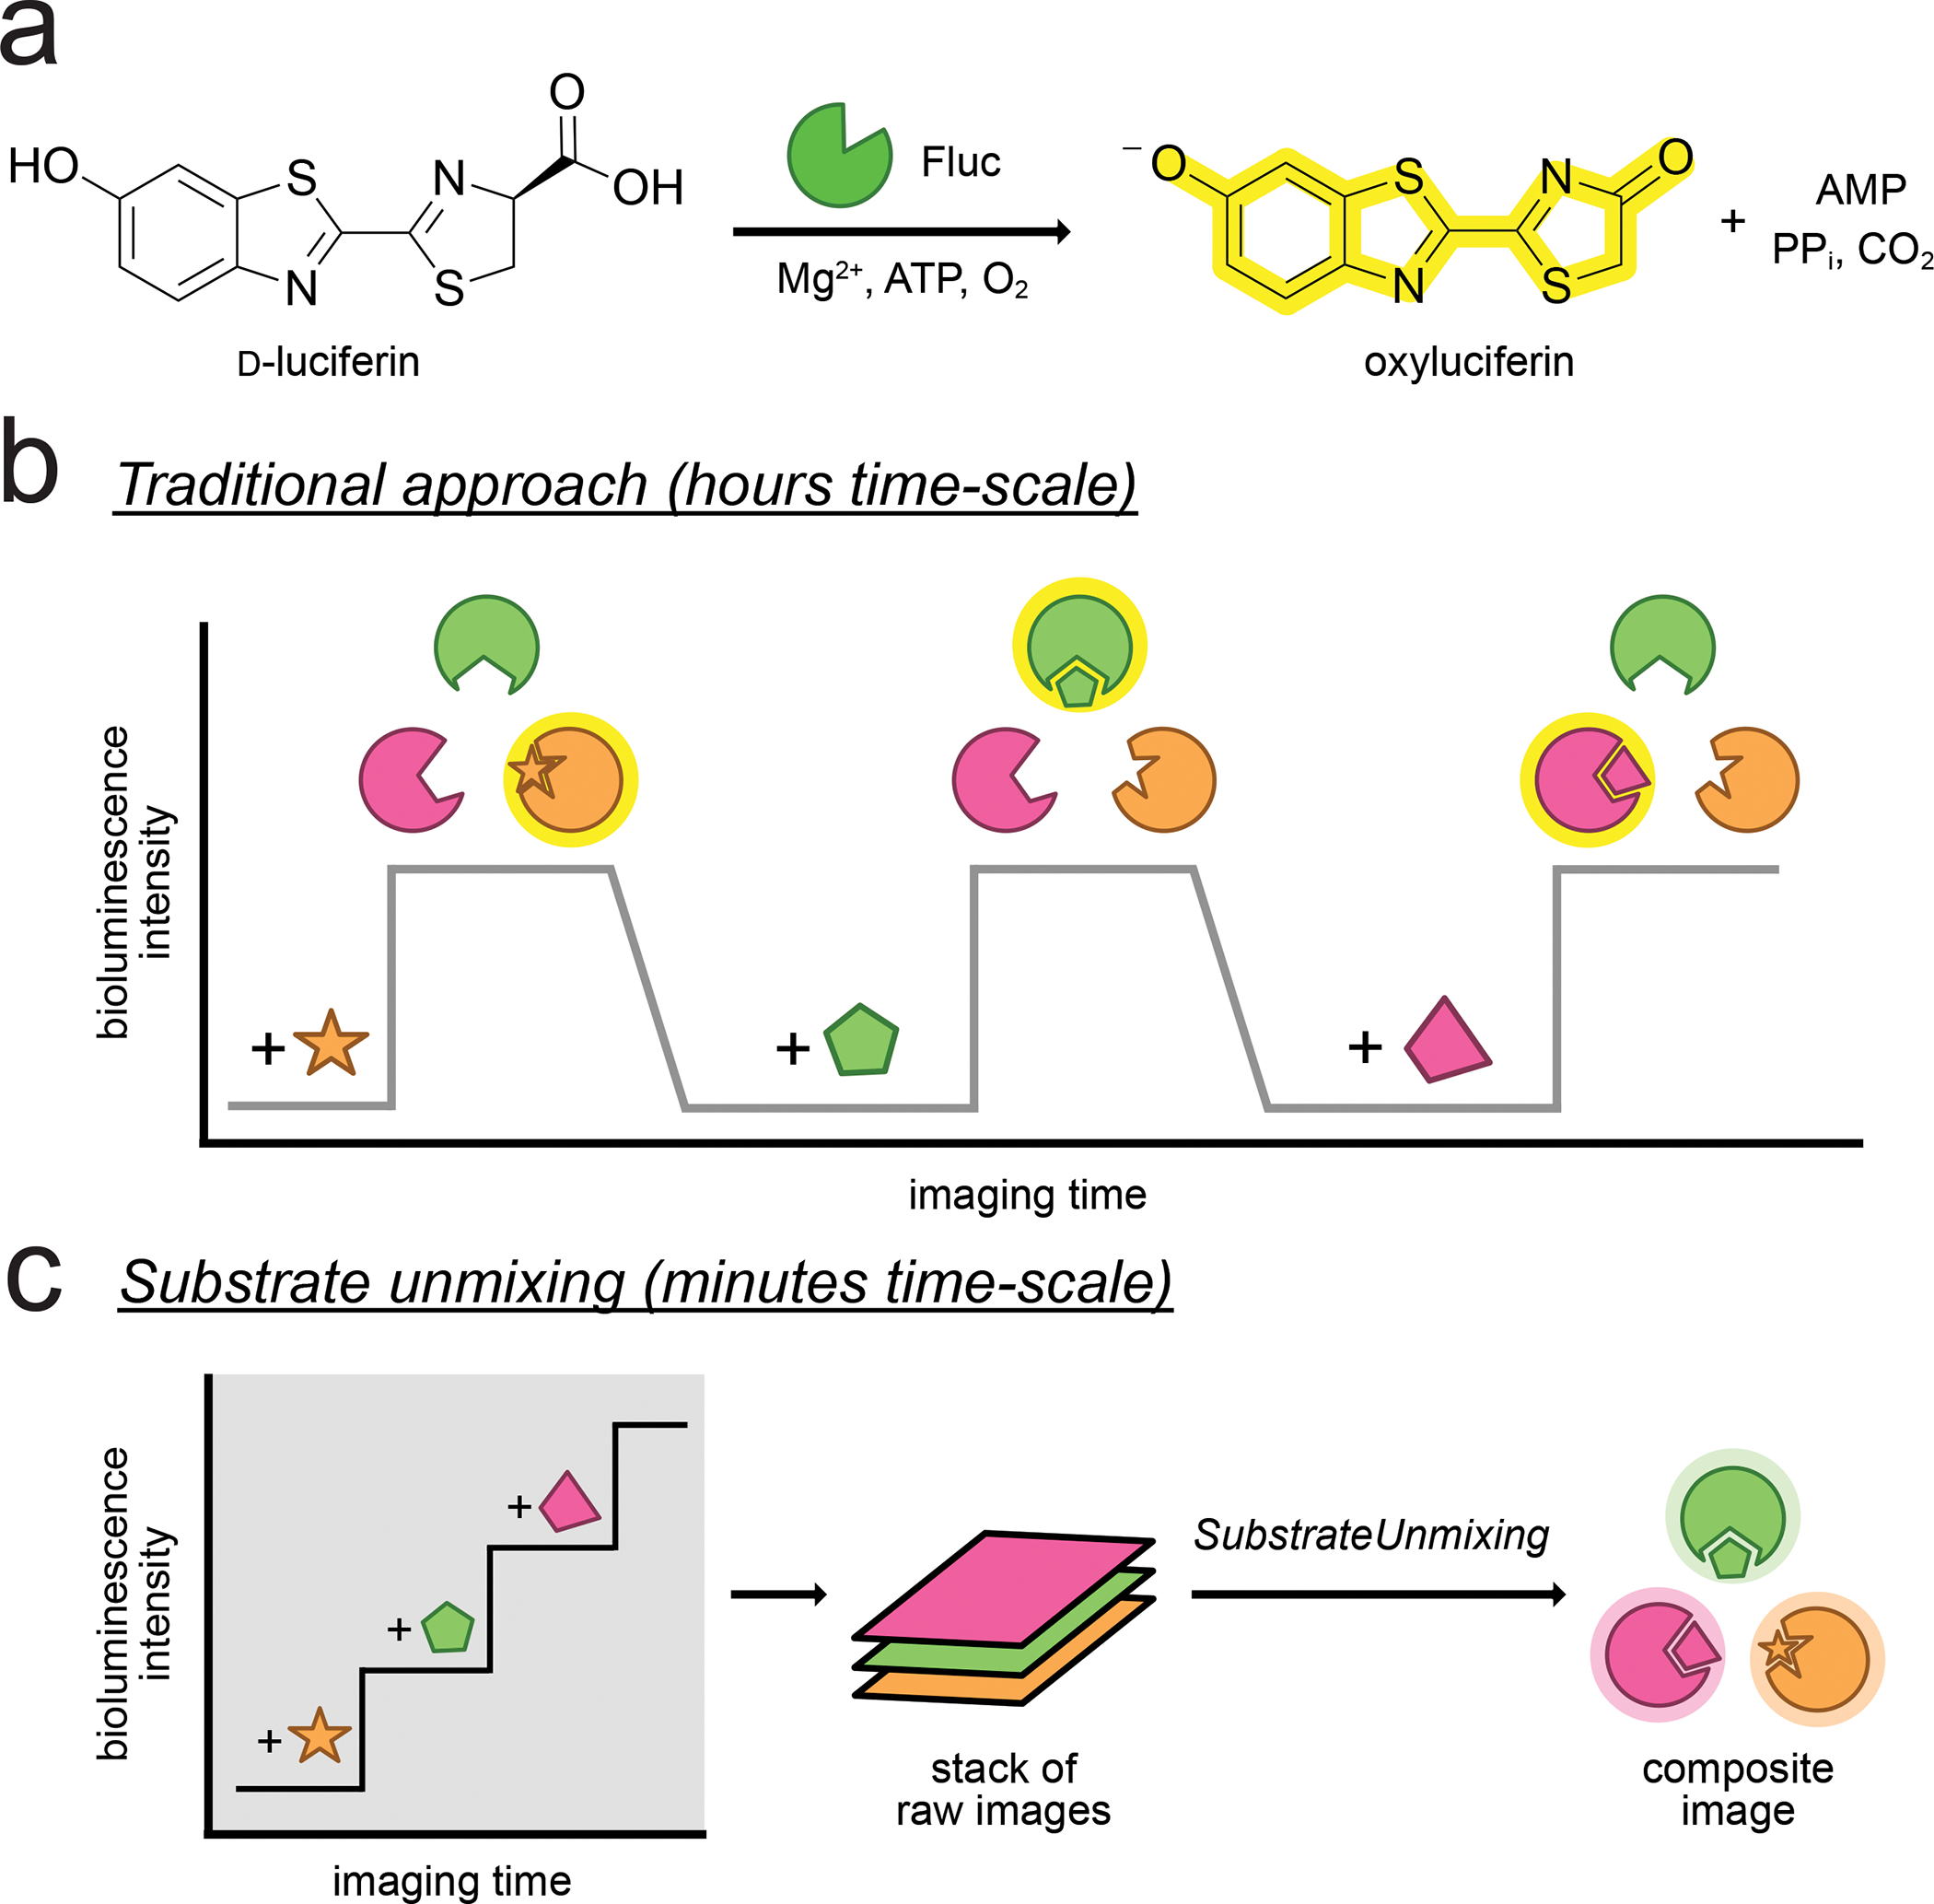
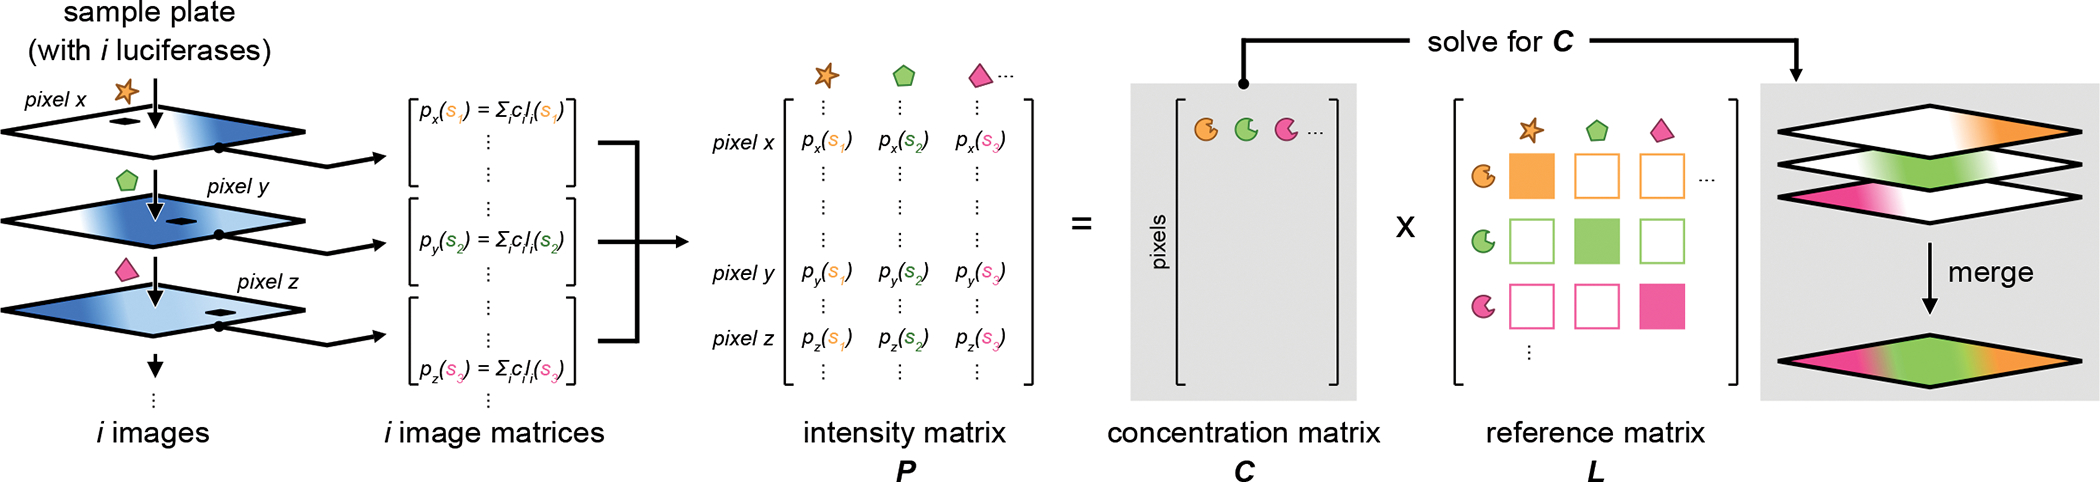
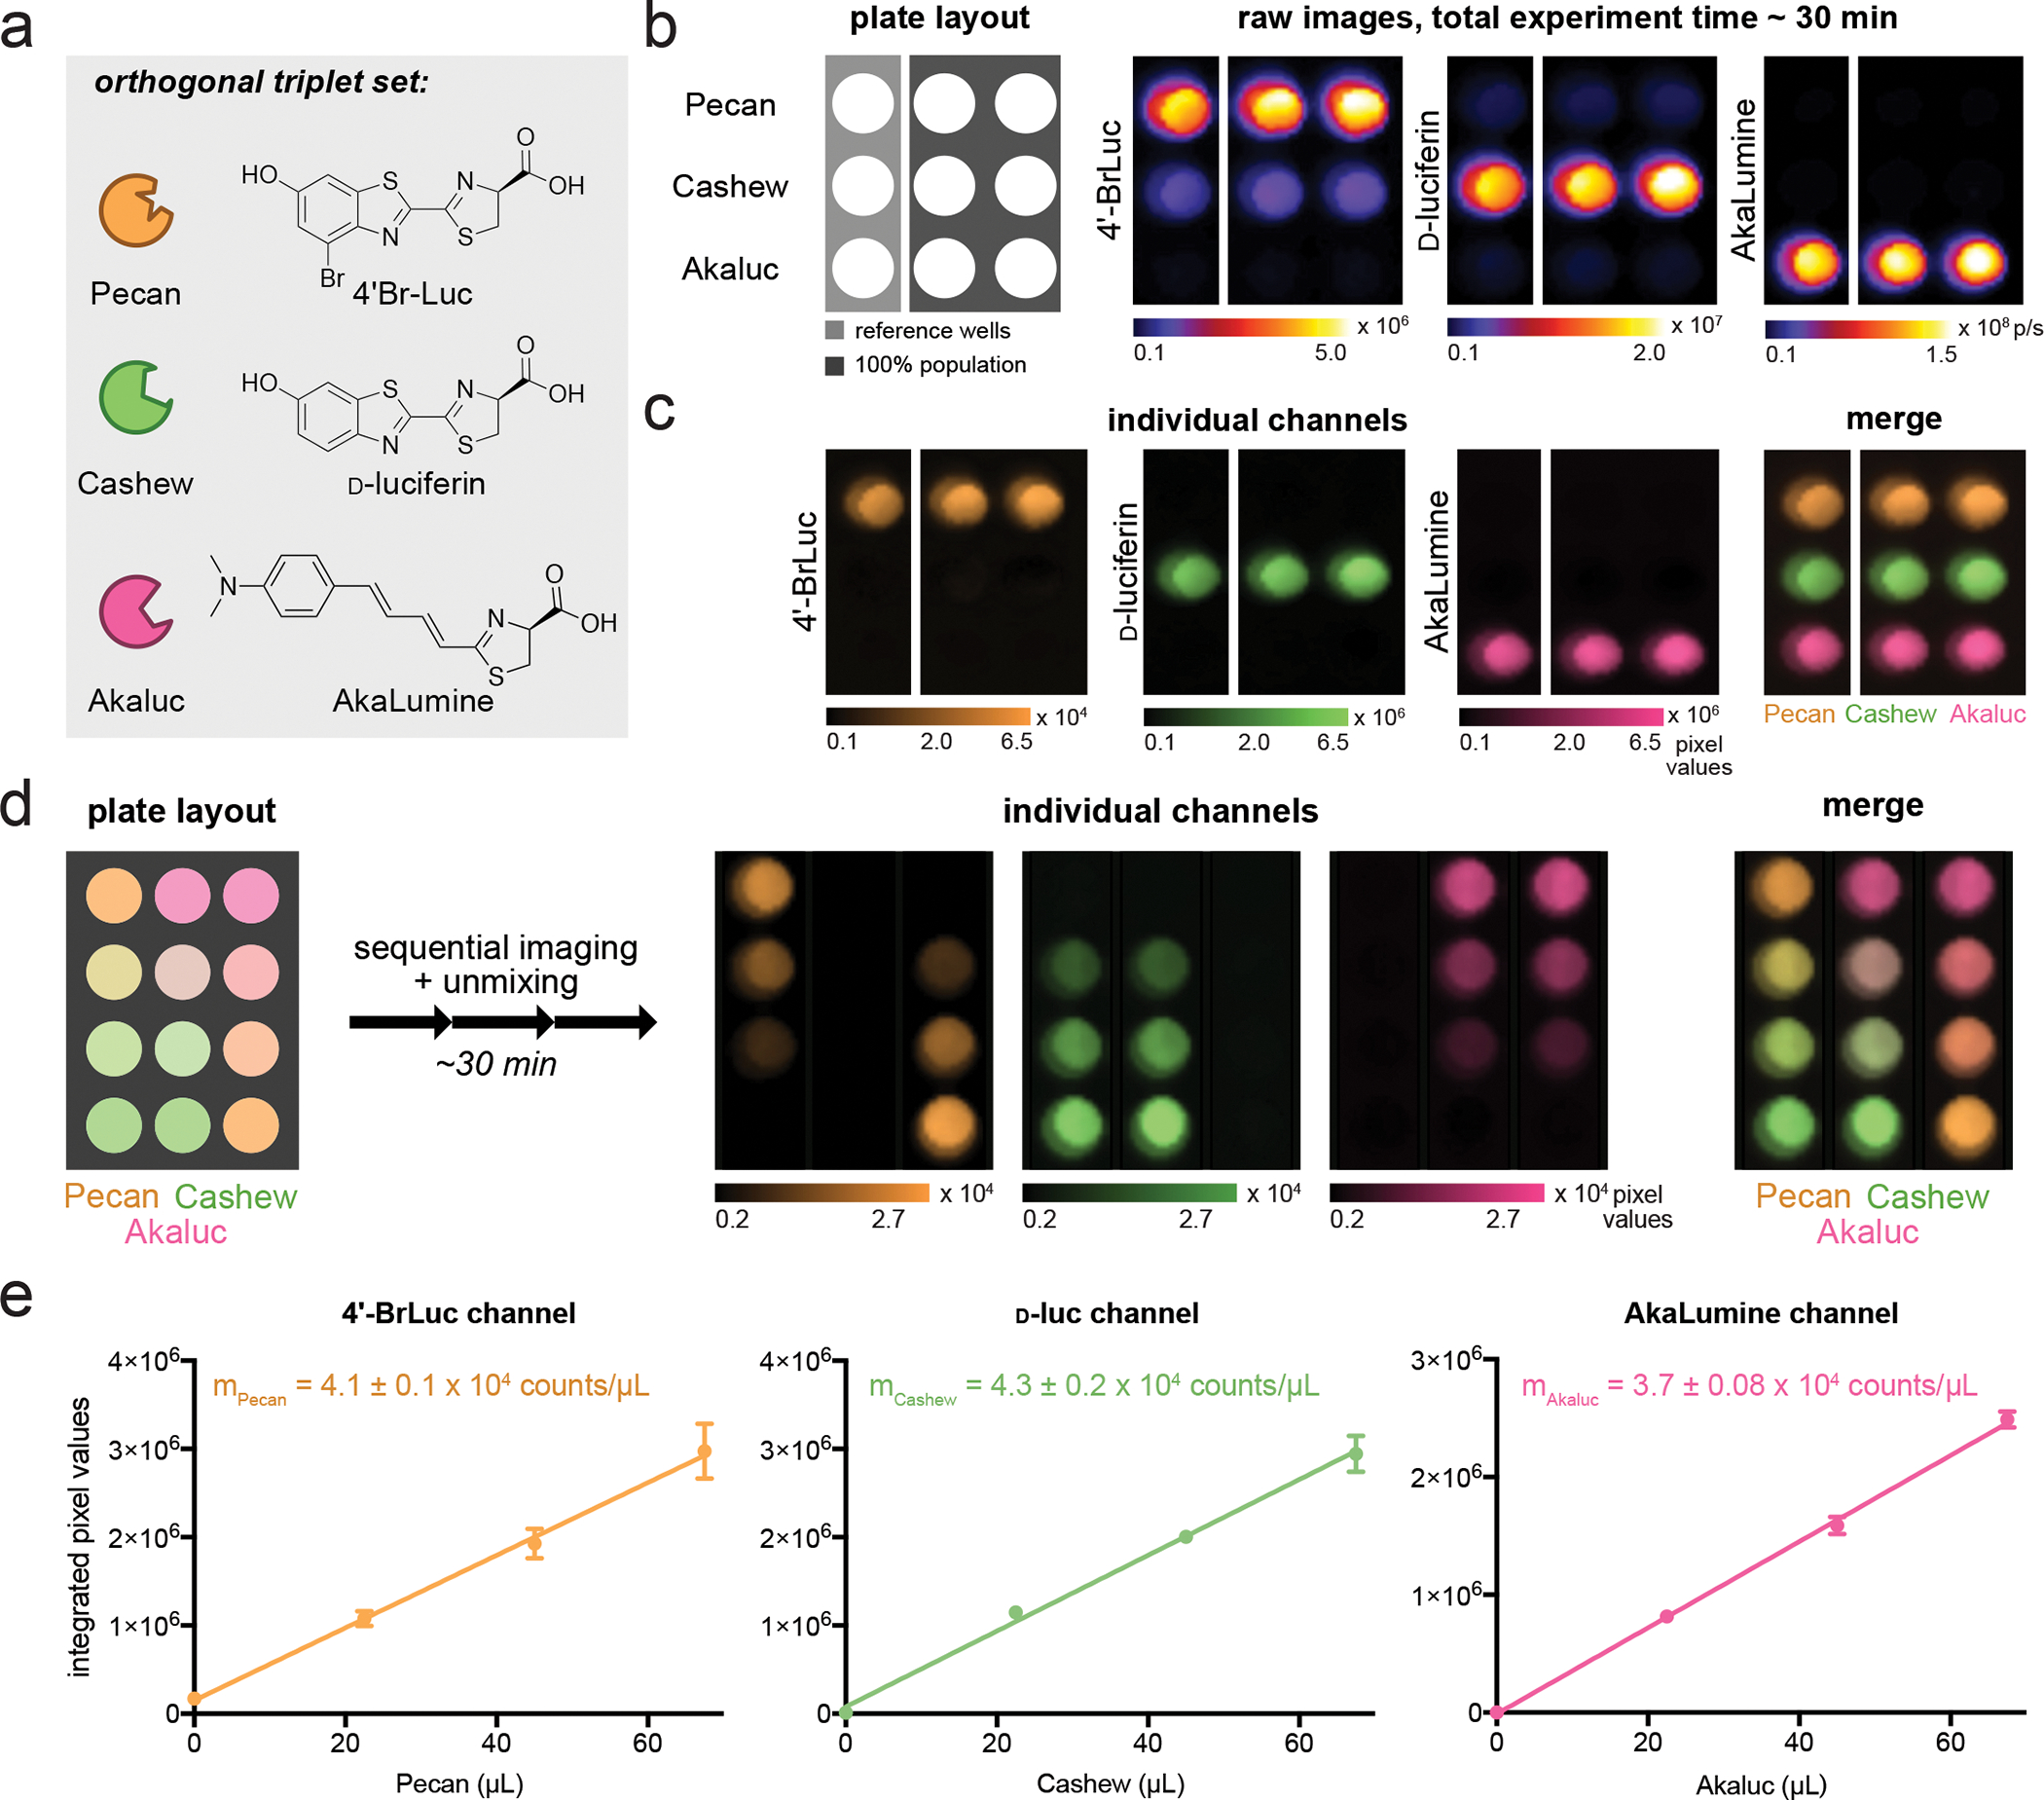
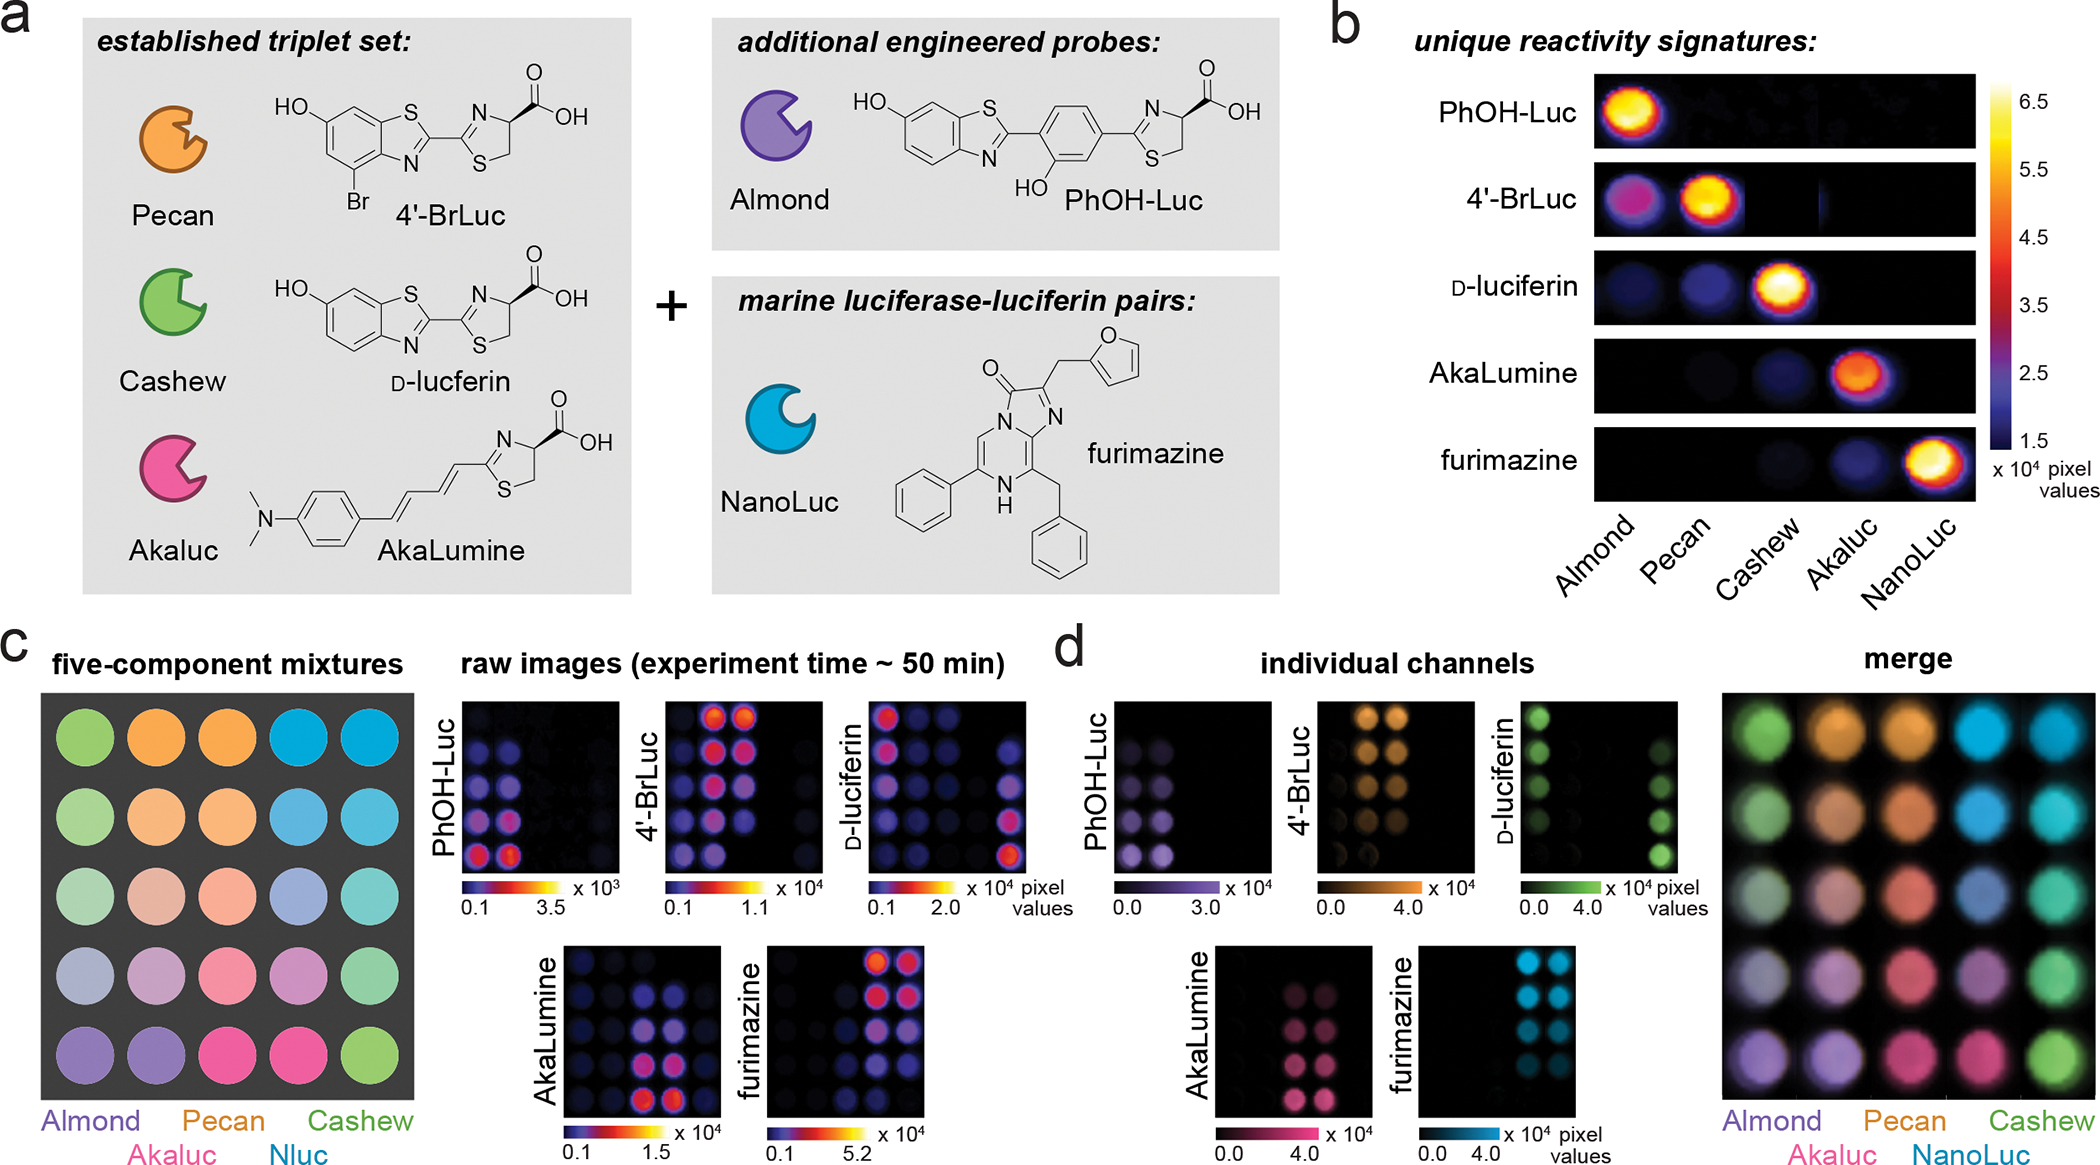
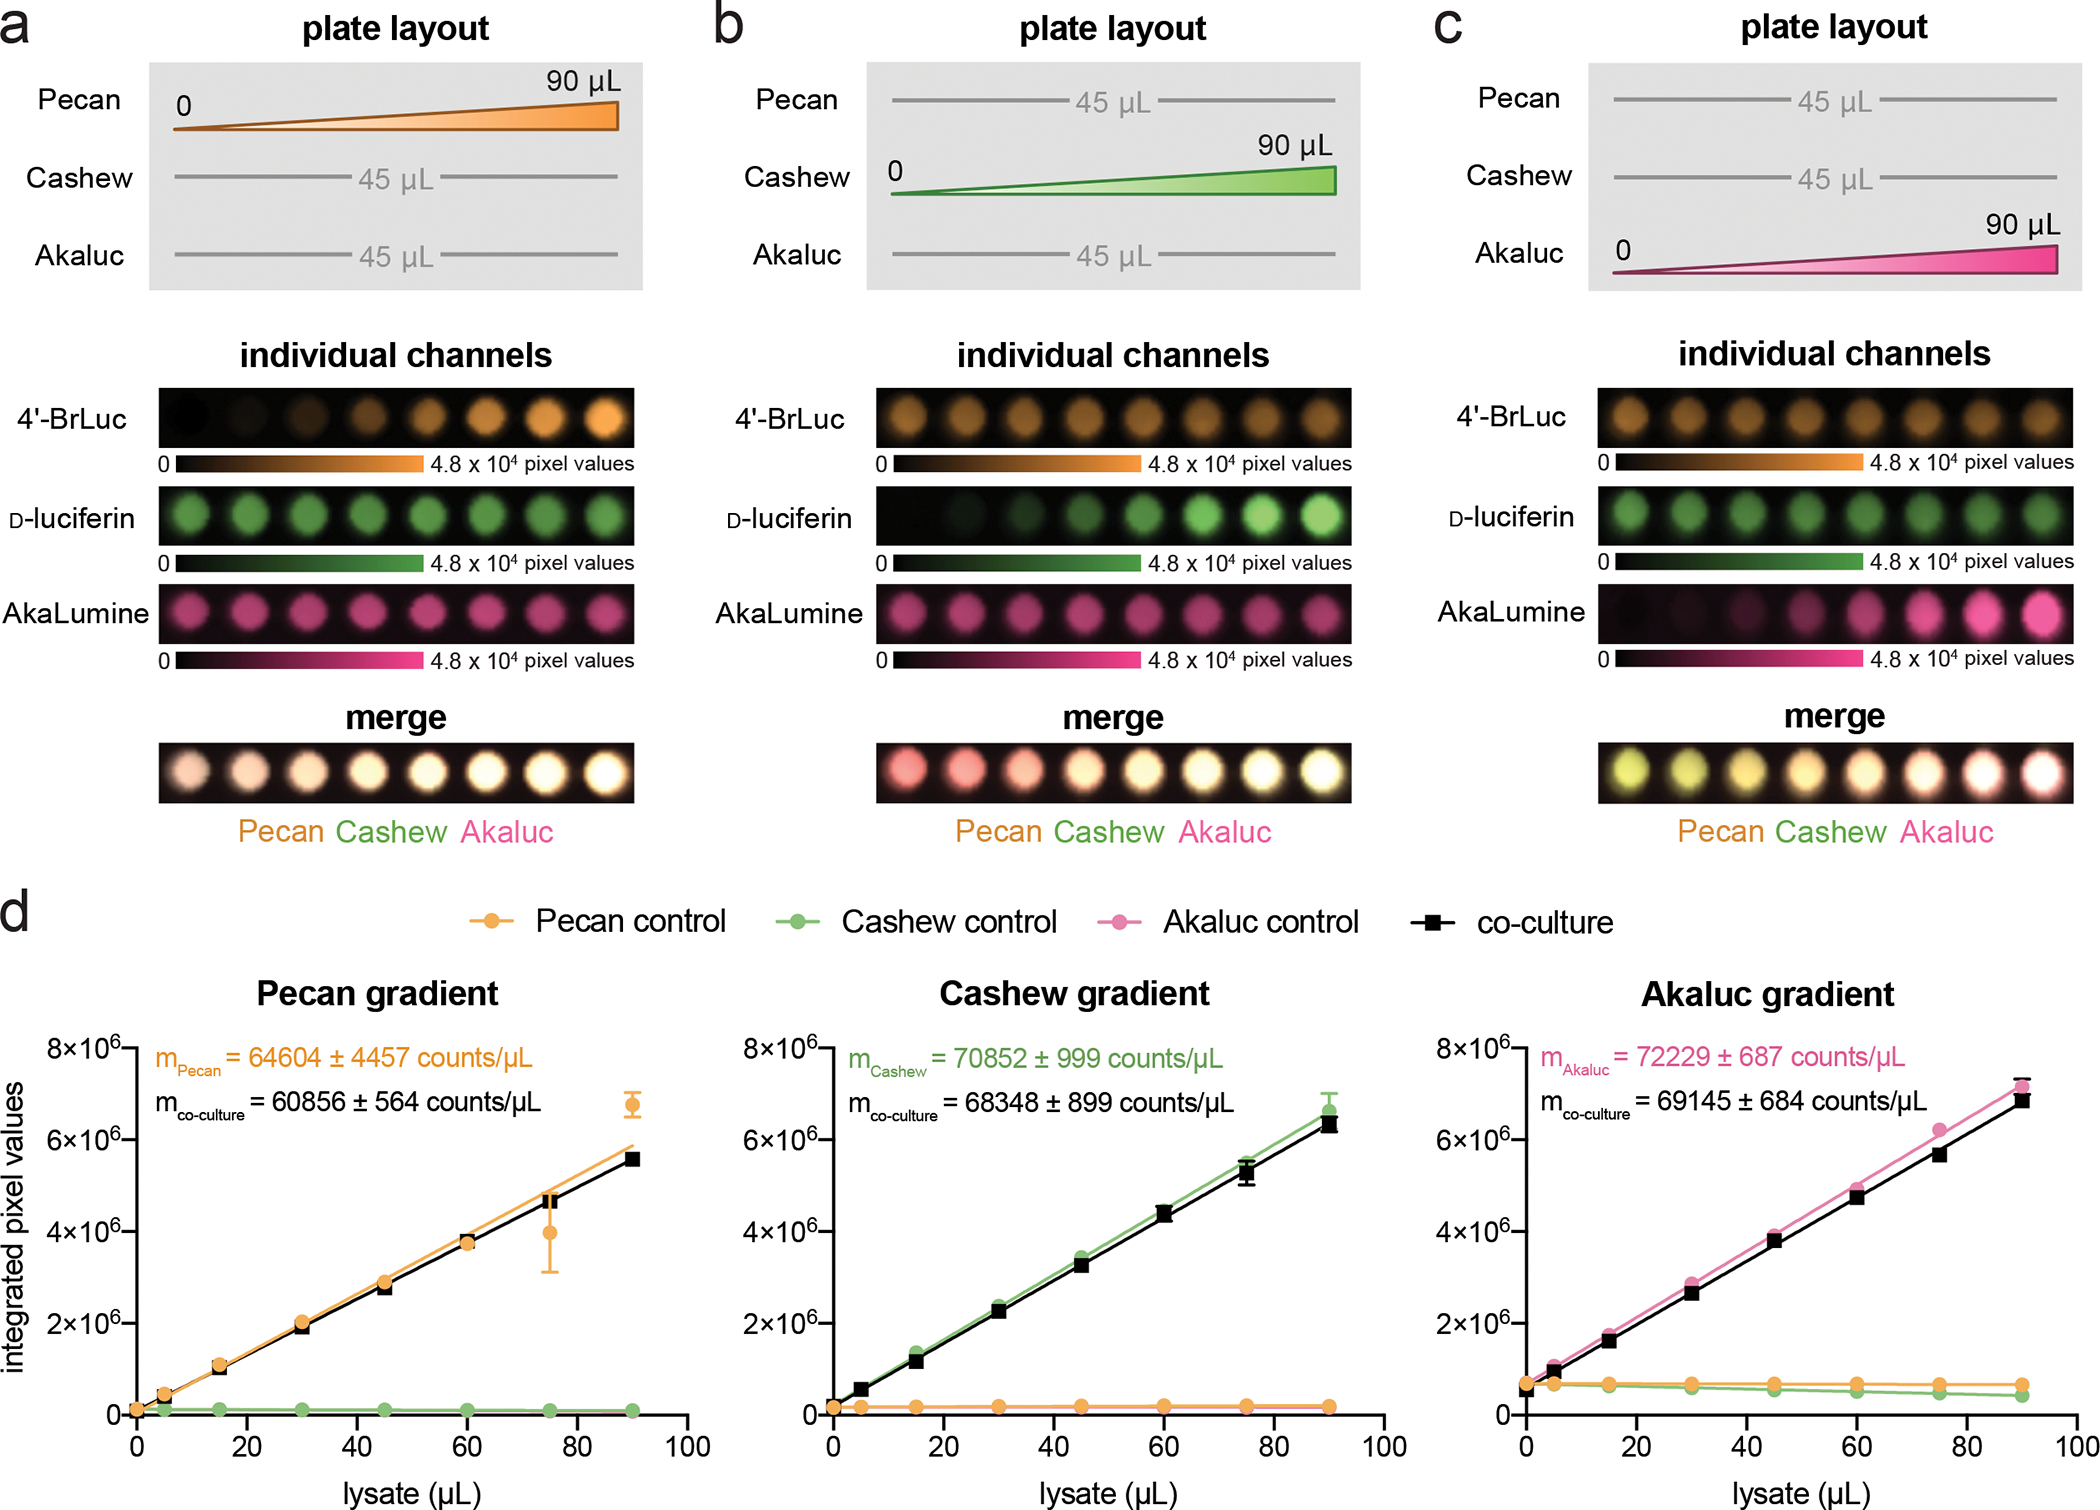
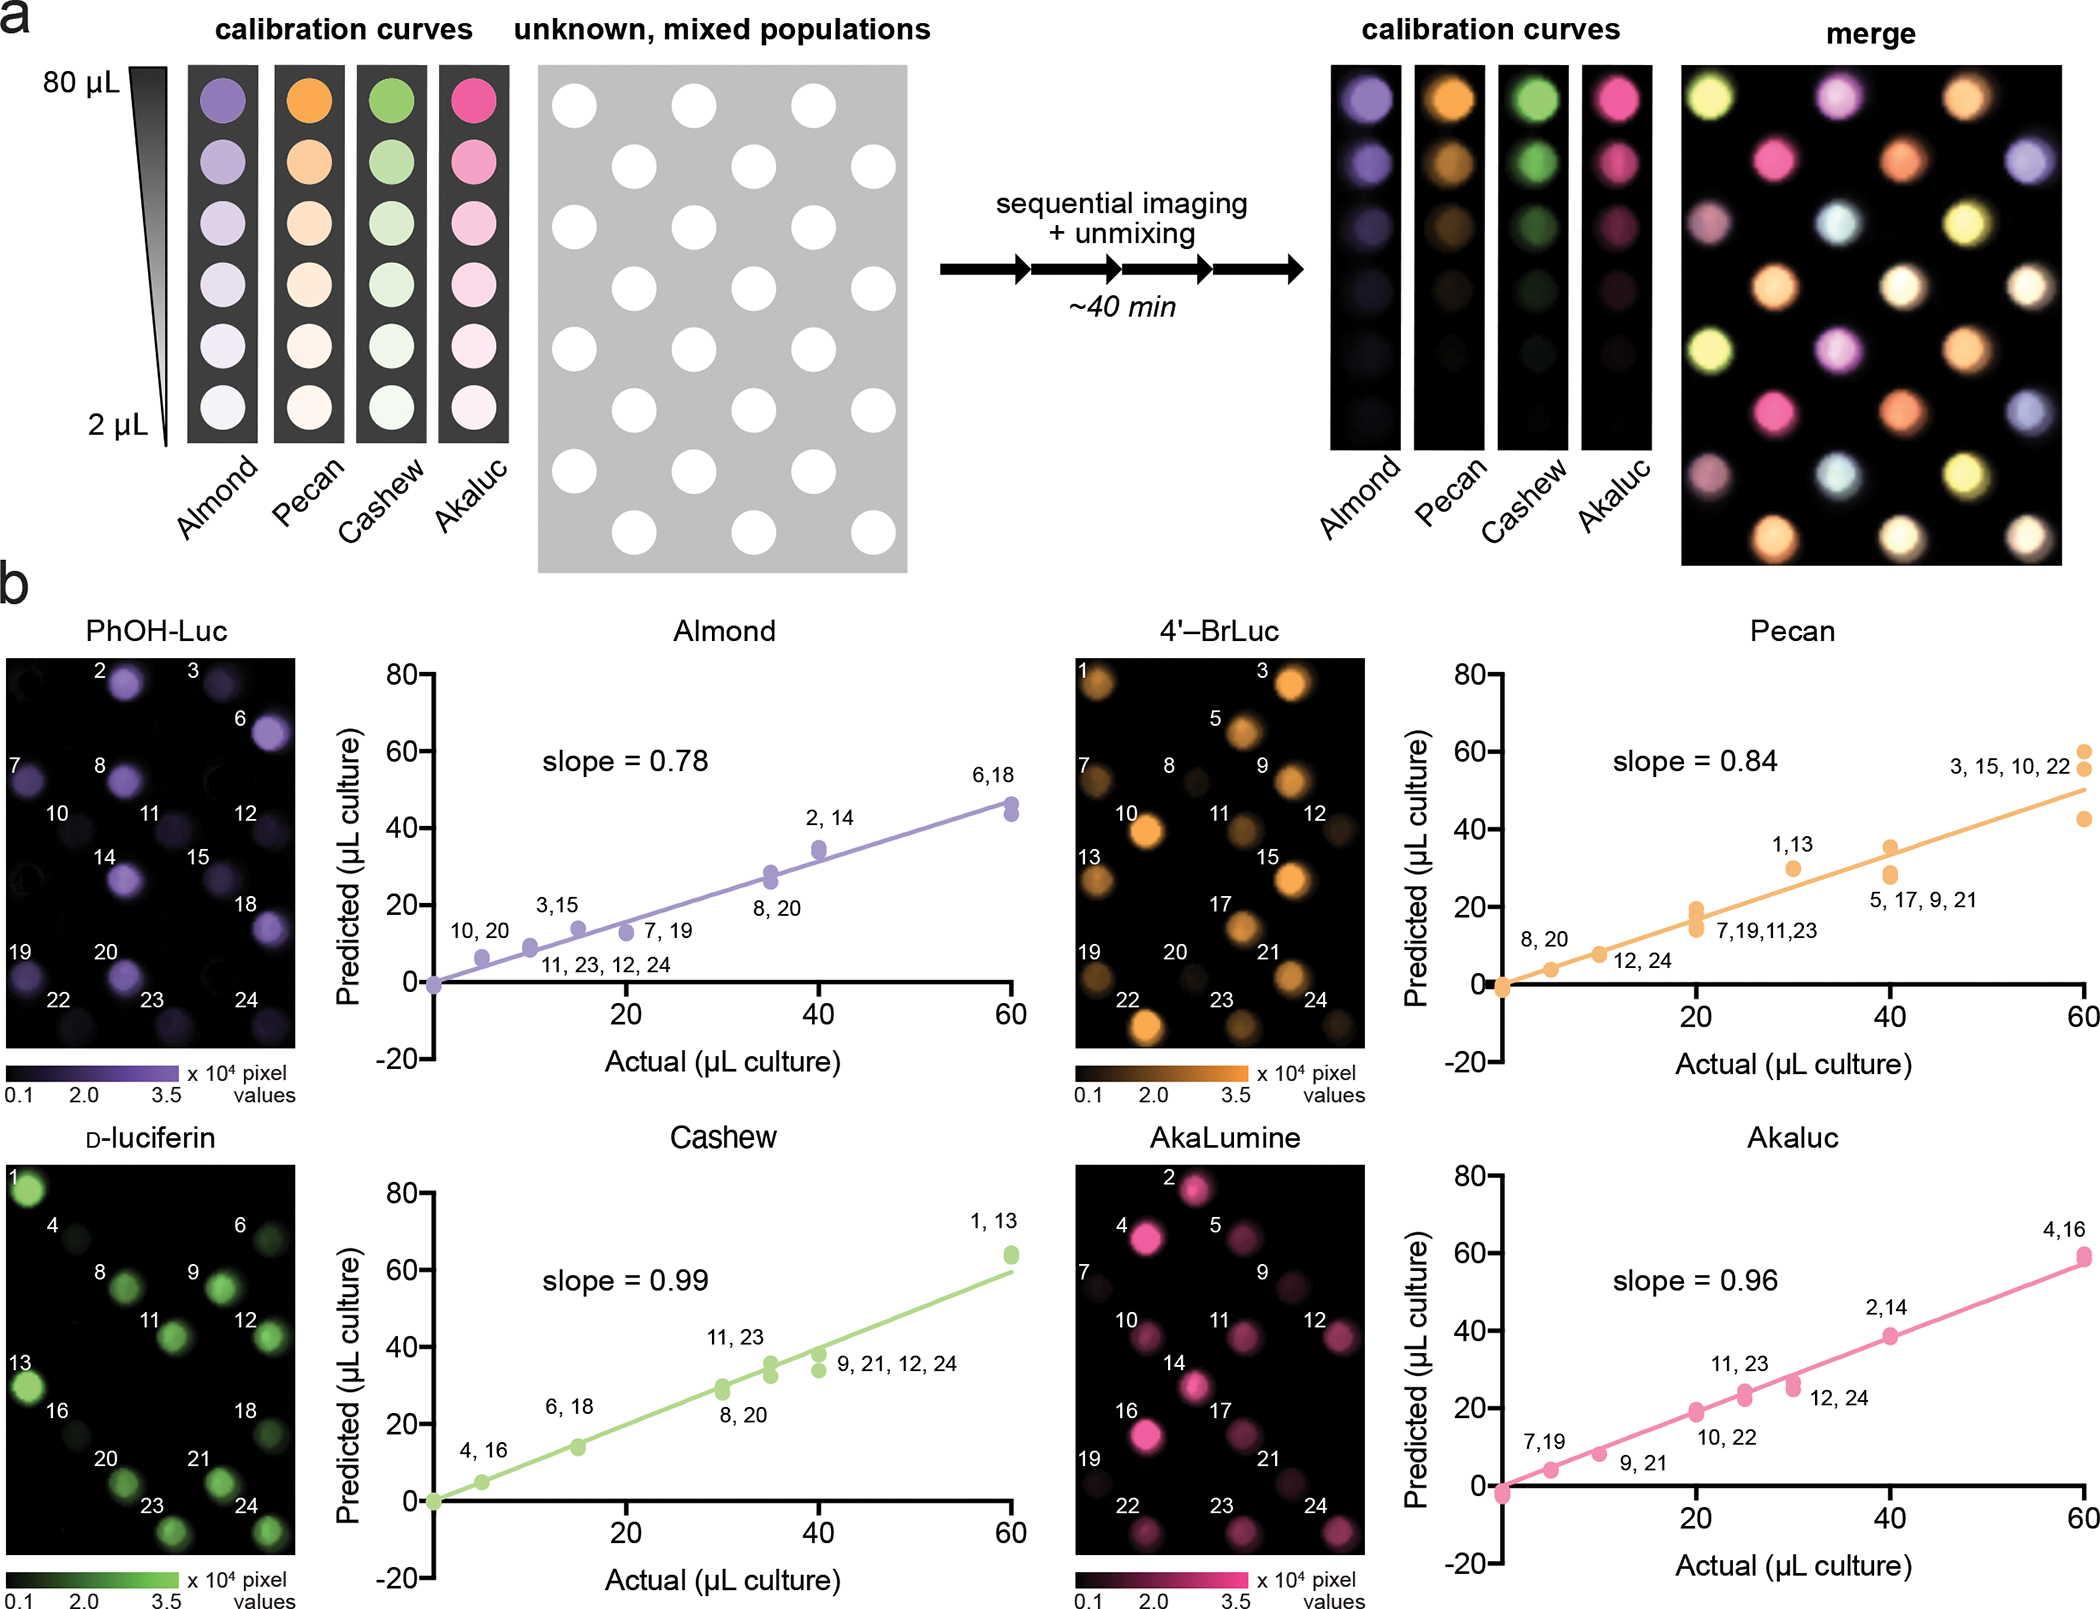
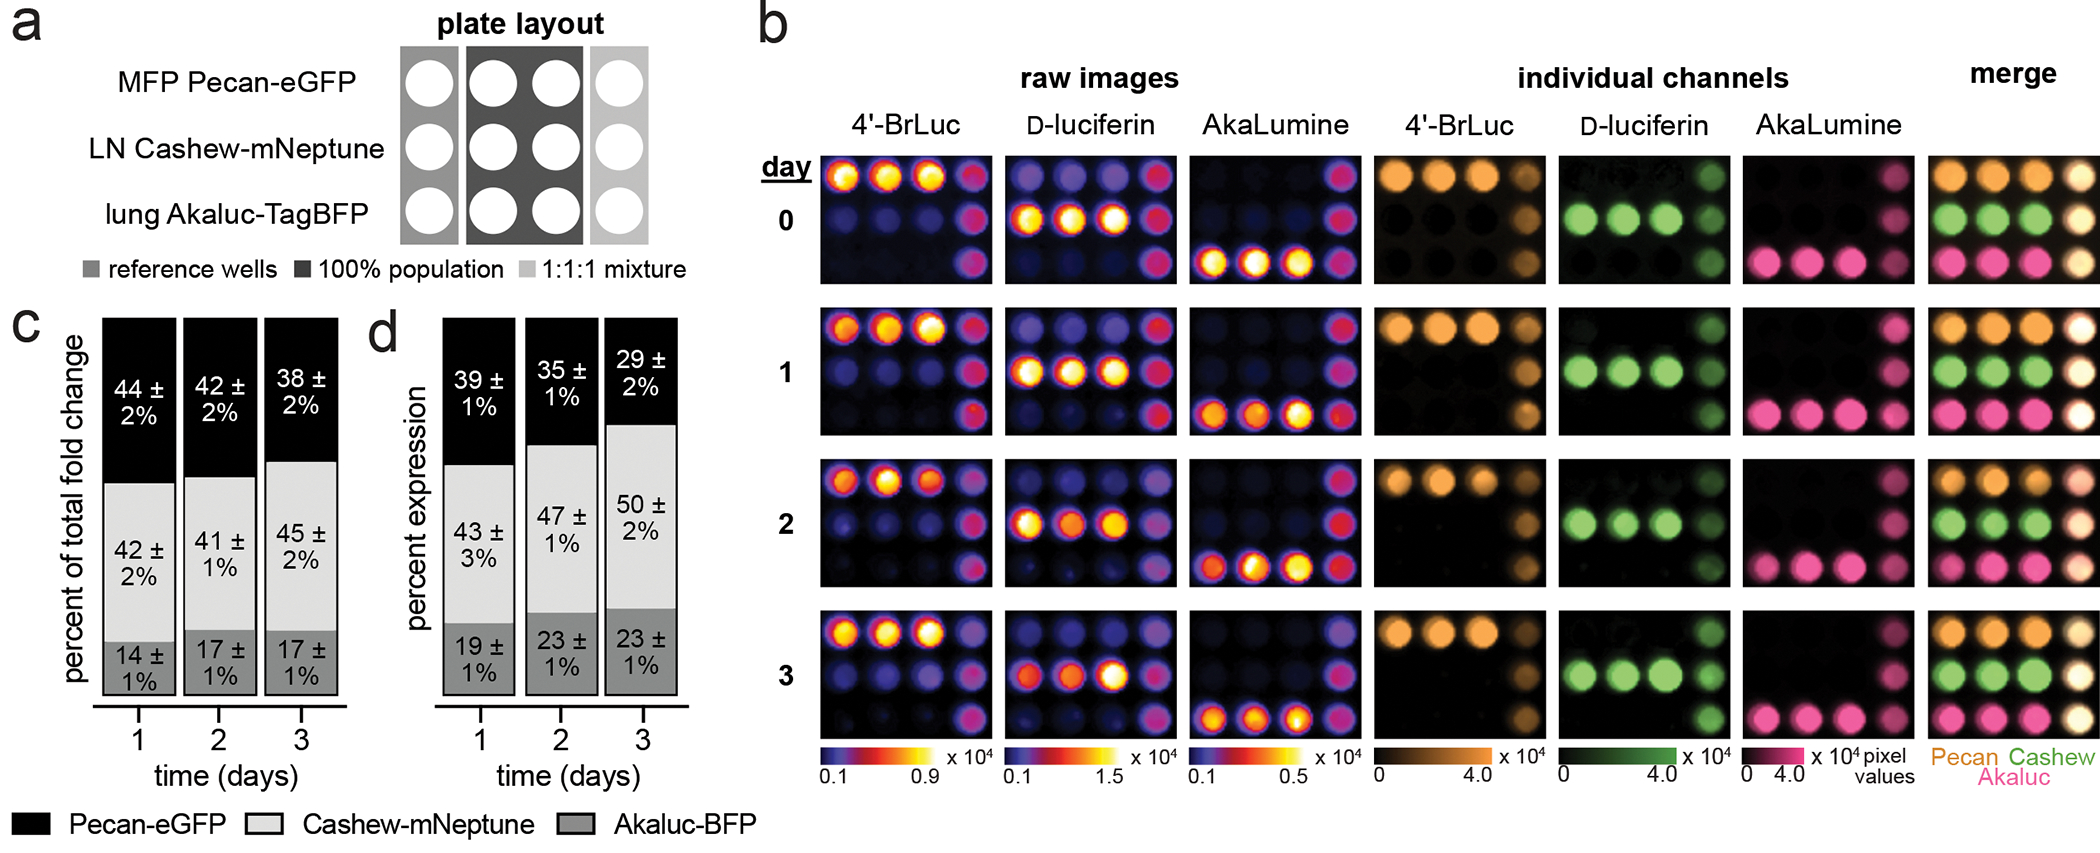
Bioluminescent tools can illuminate cellular features in whole organisms. Multi-component tracking remains challenging, though, owing to a lack of well-resolved probes and long imaging times. To address the need for more rapid, quantitative, and multiplexed bioluminescent readouts, we developed an analysis pipeline featuring sequential substrate administration and serial image acquisition. Light output from each luciferin is layered on top of the previous image, with minimal delay between substrate delivery. A MATLAB algorithm was written to analyze bioluminescent images generated from the rapid imaging protocol and deconvolute (i.e., unmix) signals from luciferase-luciferin pairs. Mixtures comprising three to five luciferase reporters were readily distinguished in under 50 min; this same experiment would require days using conventional workflows. We further showed that the algorithm can be used to accurately quantify luciferase levels in heterogeneous mixtures. Based on its speed and versatility, the multiplexed imaging platform will expand the scope of bioluminescence technology.

Keywords: bioluminescence; imaging; luciferase; luciferin; multiplexing; unmixing.


Conflict of interest statement

Declaration of interests J.A.P. is a member of the Editorial Advisory Board for Cell Chemical Biology.

Figures

Figure 1.
Figure 1.. Rapid, multiplexed bioluminescence imaging via sequential substrate administration and serial acquisition.
(a) Optical imaging with bioluminescent probes. A photon of light is produced when D-luciferin (D-luc) is oxidized by firefly luciferase (Fluc). (b) Traditional approach for resolving multiple bioluminescent reporters. Signal from one luciferin must clear before addition of the next luciferin. The required imaging time scales with the number of probes, and can be impractical when more than three targets are involved. (c). Imaging times can be shortened by consecutive substrate application. The resulting images comprise multiple layers of photon output, and require an unmixing step to deconvolute the signal source.
Figure 2.
Figure 2.. Derivation of the SubstrateUnmixing algorithm.
The collection of acquired images is first transformed to an array of matrices. Photon signal at each pixel is defined as the sum of photons produced from the given substrate with the plausible luciferase present. Next, the compiled image matrices are converted into an intensity matrix P. This matrix can be re-defined as a system of linear equations according to equation (4). Lastly, solving for the concertation matrix C affords a stack of unmixed images, representing the abundance of individual luciferases.
Figure 3.
Figure 3.. Rapid, three-component BLI via SubstrateUnmixing.
(a) The identity of luciferases and chemical structures of luciferins chosen for multiplexing. (b) DB7 cells expressing each luciferase were plated as shown. The corresponding substrates ([4ʹ-BrLuc] = [D-luc] = [AkaLumine] = 100 μM) were administered, beginning with the dimmest luciferin. Images were acquired after each addition. Image acquisition was completed within 30 minutes. (c) The raw data from (b) were unmixed using SubstrateUnmixing and false colored. (d) Bacteria expressing Pecan, Cashew, or Akaluc were plated as shown. The corresponding substrates ([4ʹ-BrLuc] = [D-luc] = [AkaLumine] = 100 μM) were administered and images were acquired after each addition. The raw data were unmixed using SubstrateUnmixing, false colored, and overlaid. (e) Linear regression analyses were performed on each channel from (a). In the 4’-BrLuc channel, the R2 value for signal from Pecan signal was 0.998. In the D-luc channel, the R2 value for signal from Cashew was 0.996. In the AkaLumine channel, the R2 value for signal from Akaluc was 0.999. Error bars represent the standard error of the mean for n = 2 replicate experiments.
Figure 4.
Figure 4.. Rapid, five-component BLI via SubstrateUnmixing.
(a) The identity of luciferases and chemical structures of luciferins chosen for multiplexing. (b) Unique emission barcodes produced from luciferin addition. Signal intensities were normalized to highlight the distinct patterns. (c) Gradients of Almond, Pecan, Cashew, Akaluc and NanoLuc were plated as shown. The corresponding substrates were administered in the following order: PhOH-Luc (250 μM), 4′-BrLuc (100 μM), D-luc (100 μM), AkaLumine (100 μM), then furimazine (FRZ, 1:100 dilution from commercial stocks). An image was acquired after each addition. (d) The raw data from (c) were subjected to SubstrateUnmixing, unmixed, false colored, and overlaid.
Figure 5.
Figure 5.. Analyzing changes in reporter ratio with SubstrateUnmixing.
(a) Pecan, (b) Cashew, and (c) Akaluc were plated in a gradient (as shown). The amount of one reporter was diluted to mimic a change in reporter expression over time. The other two reporters were kept constant. The samples were treated with 4′-BrLuc (100 μM), D-luc (100 μM), and AkaLumine (100 μM) in succession. Raw images were acquired after each substrate addition and processed by the algorithm. The substrate-specific signals were unmixed, assigned false colors, and overlaid. (d) Quantification of images from (a)–(c), processed via SubstrateUnmixing and fit via linear regression. Pecan, Cashew, and Akaluc controls represent samples that only contained a gradient of one reporter (not shown). In each scenario, the unmixed signals correlated linearly with the amount of reporter in the single population (R2 = 0.938 for 4ʹ-BrLuc channel, R2 = 0.997 for D-luc channel, and R2 = 0.999 for AkaLumine channel) and co-culture samples (R2 = 0.999 for Pecan channel, R2 = 0.997 for D-luc channel, R2 = 0.999 for AkaLumine channel).
Figure 6.
Figure 6.. Multicomponent, quantitative BLI via SubstrateUnmixing.
(a) Different amounts of Almond, Pecan, Cashew, and Akaluc were mixed, and distributed across a 96-well plate as shown. A total of twelve unique mixtures, comprising two, three, or four reporters, were analyzed. A calibration curve for each luciferase was also plated on the same plate. The samples were treated sequentially with PhOH-Luc (250 μM), 4′-BrLuc (100 μM), D-luc (100 μM), and AkaLumine (100 μM). Raw images were acquired after each substrate addition, unmixed, and overlaid. (b) From each unmixed channel, a standard curve was computed using unmixed signal from the calibration wells. The amount of luciferase in the unknown wells was computed, and plotted against the actual amount of reporter plated. Values indicate the well number of the mixed population.
Figure 7.
Figure 7.. Heterogeneous cell populations can be monitored over time with SubstrateUnmixing.
(a) MFP cells expressing Pecan-eGFP, LN cells expressing Cashew-mNeptune, and lung cells expressing Akaluc-BFP were plated as shown at the time of imaging. Cells were imaged on the day of seeding (day 0) and three subsequent days. (b) On each day the samples were treated with 4′-BrLuc (100 μM), D-luc (100 μM), and AkaLumine (100 μM) in succession. Raw images were acquired after each substrate addition and processed by SubstrateUnmixing. The substrate-specific signals were unmixed, assigned false colors, and overlaid. (c) Quantification of luminescence values (p/s) plotted as the fold change versus day 0 & normalized to expression of fluorescent reporter. (d) Quantification of 1:1:1 mixture by flow cytometry normalized to expression of the single population.

Similar articles

Cited by

References

    1. Aalipour A, Chuang HY, Murty S, D’Souza AL, Park SM, Gulati GS, Patel CB, Beinat C, Simonetta F, Martinić I, et al. (2019). Engineered immune cells as highly sensitive cancer diagnostics. Nat. Biotechnol. 37, 531–539. - PMC - PubMed
    1. Aswendt M, Vogel S, Schäfer C, Jathoul A, Pule M, and Hoehn M (2019). Quantitative in vivo dual-color bioluminescence imaging in the mouse brain. Neurophotonics 6, 025006. - PMC - PubMed
    1. Berezin MY, and Achilefu S (2010). Fluorescence Lifetime Measurements and Biological Imaging. Chem. Rev. 110, 2641–2684. - PMC - PubMed
    1. Chaincy K, Olivier C, Tamara LT, Heng X, and Bradley WR (2007). Three-dimensional reconstruction of in vivo bioluminescent sources based on multispectral imaging. J. Biomed. Opt. 12, 1–12. - PubMed
    1. Chu J, Oh Y, Sens A, Ataie N, Dana H, Macklin JJ, Laviv T, Welf ES, Dean KM, Zhang F, et al. (2016). A bright cyan-excitable orange fluorescent protein facilitates dual-emission microscopy and enhances bioluminescence imaging in vivo. Nat. Biotechnol. 34, 760–767. - PMC - PubMed

Publication types

MeSH terms