HIF-3 α-Induced miR-630 Expression Promotes Cancer Hallmarks in Cervical Cancer Cells by Forming a Positive Feedback Loop
- PMID: 36277475
- PMCID: PMC9584697
- DOI: 10.1155/2022/5262963
HIF-3 α-Induced miR-630 Expression Promotes Cancer Hallmarks in Cervical Cancer Cells by Forming a Positive Feedback Loop
Abstract
Purpose: Hypoxia has crucial functions in the development and metastasis of cervical cancer by inducing the expression of numerous genes, including microRNA genes. But we know little about how the hypoxia factors and microRNAs orchestrate to regulate hallmarks of cervical cancer cells.
Methods: We conducted RNA sequencing (RNA-seq) and chromatin immunoprecipitation sequencing (ChIP-seq) experiments to investigate the targets of HIF-3α or miR-630. ChIP-qPCR and RT-qPCR were carried out to validate the results of ChIP-seq and RNA-seq. Cellular, molecular, and radiation experiments were conducted to explore the functions of miR-630.
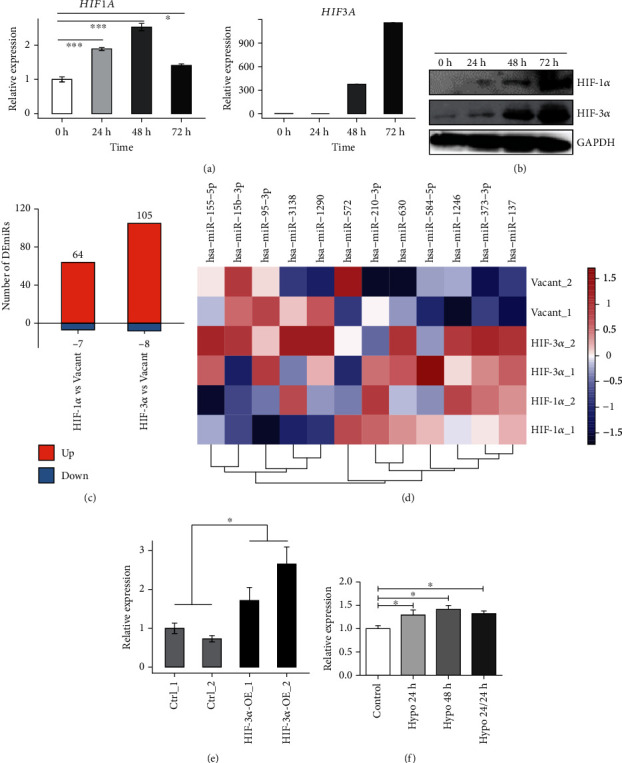
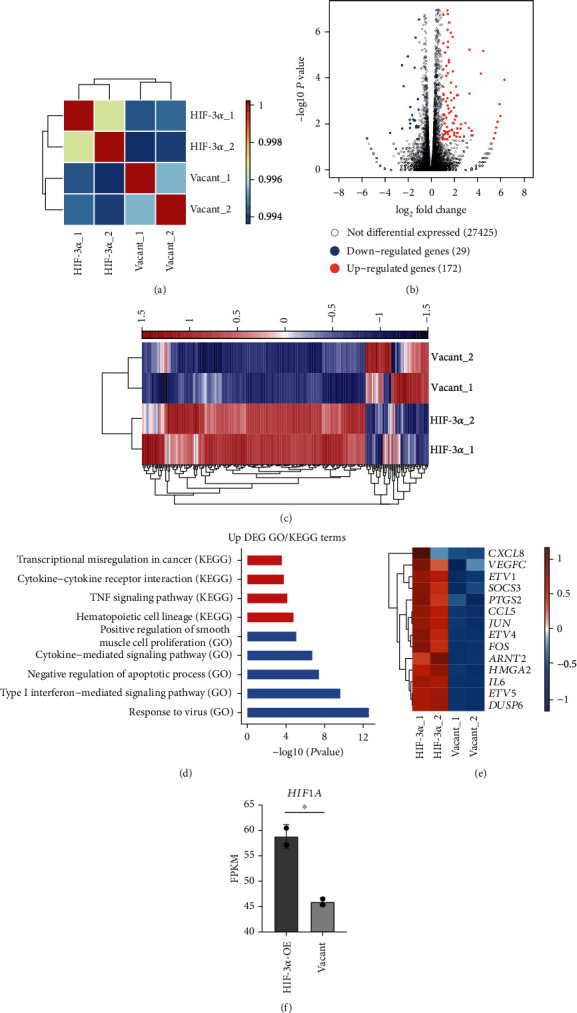
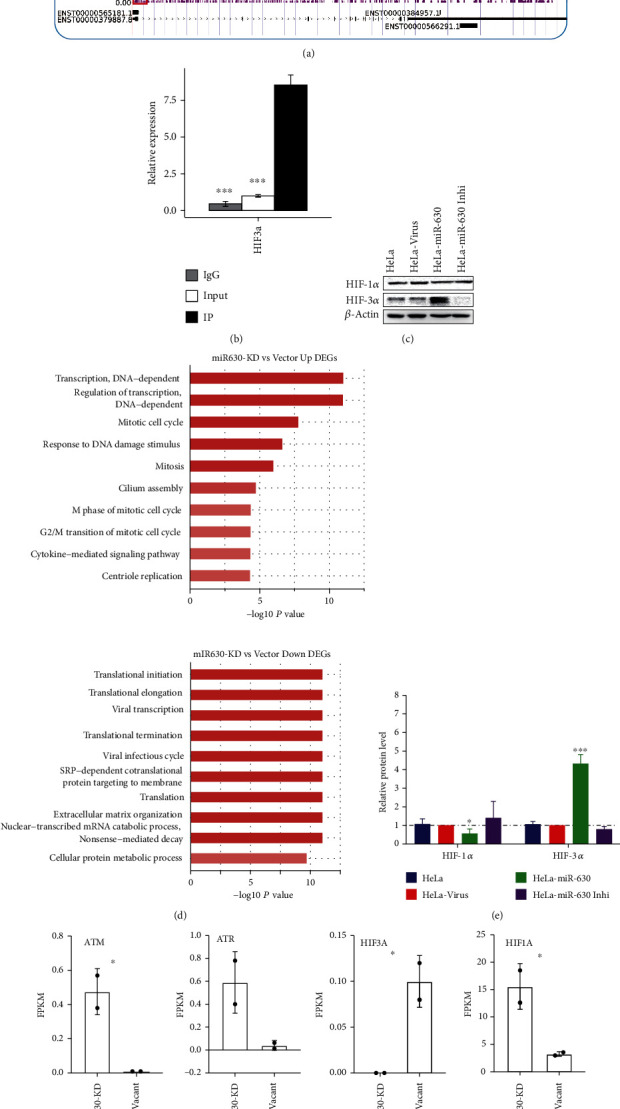
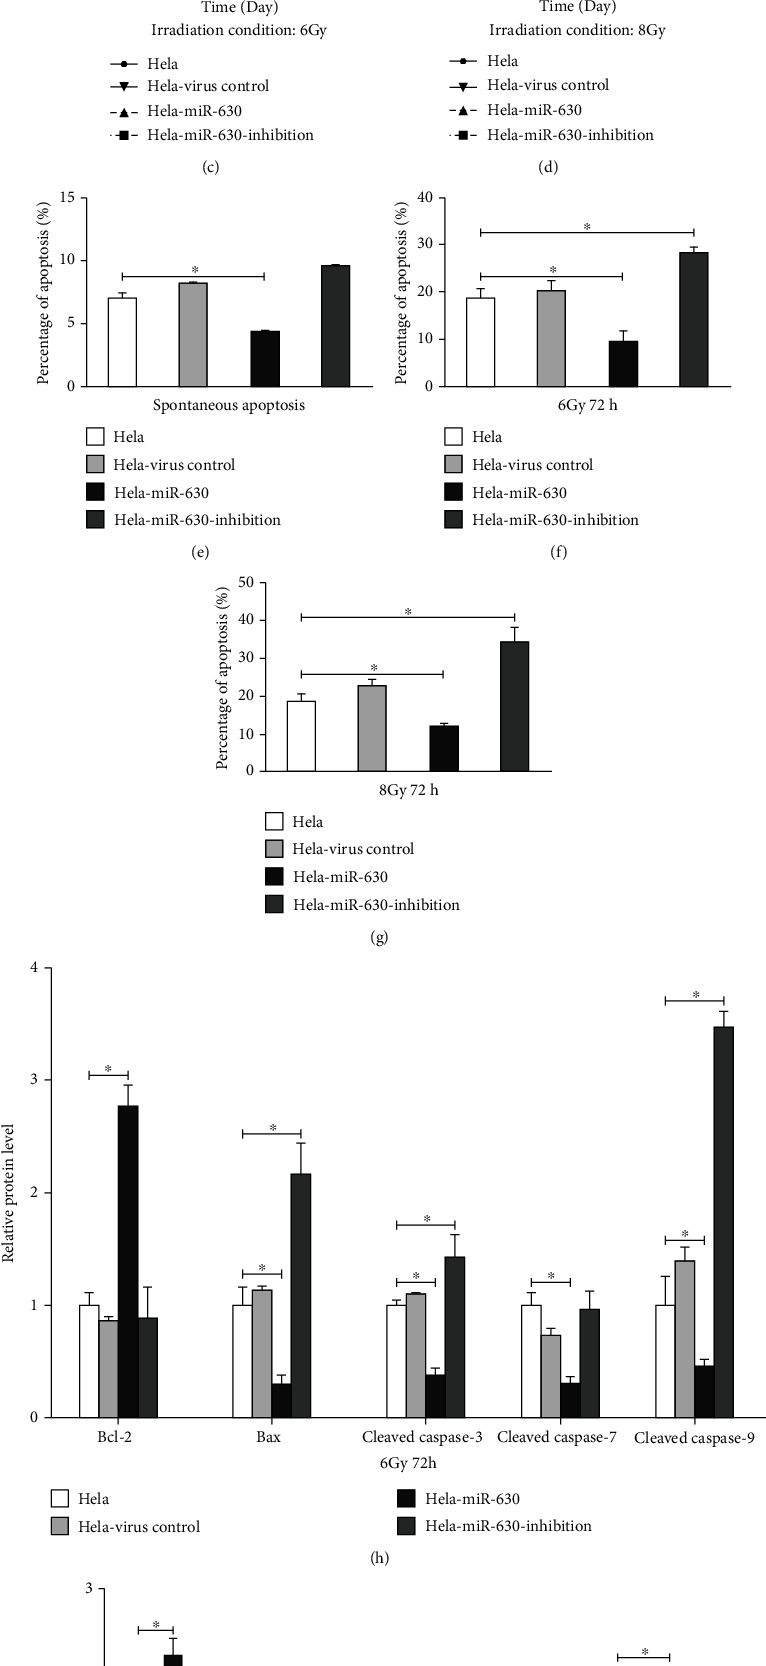
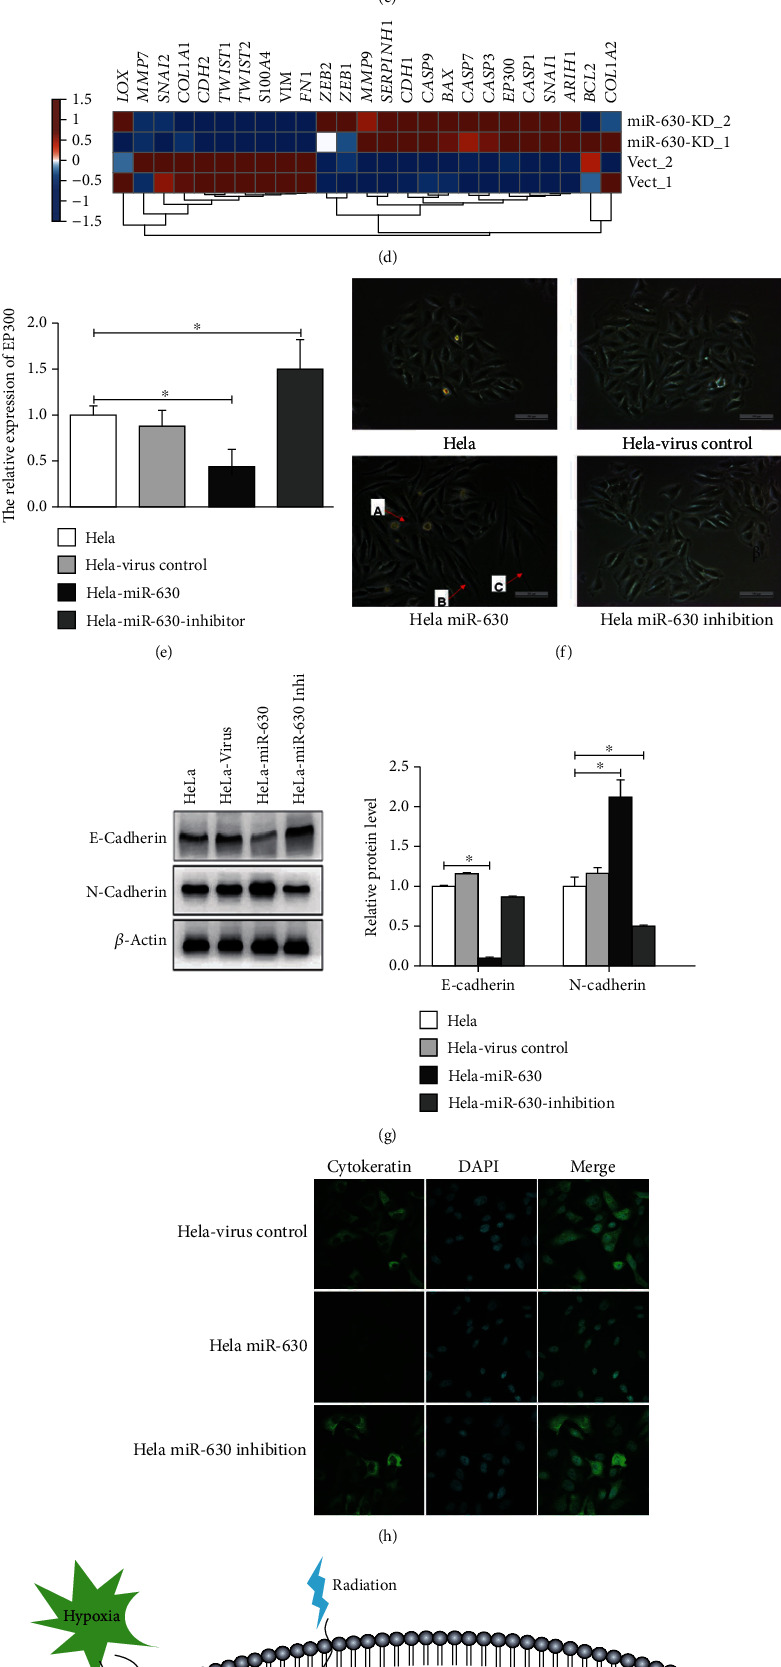
Results: In this study, we showed that hypoxia-induced overexpression of HIF-3α increased the expression of dozens of miRNAs, including miR-630. Hypoxia could also directly induce miR-630 expression. ChIP-seq data showed that HIF-3α activates miR-630 expression by directly binding to the promoter of its host gene. Meanwhile, stable overexpression of miR-630 increased the expression of HIF-3α, but repressed the expression of HIF-1α, indicating a positive feedback loop between HIF-3α and miR-630. Consequently, stable overexpression of miR-630 in HeLa cells promotes cancer hallmarks, including radioresistance, inhibition of apoptosis, increased migration and invasion, and EMT-mediated metastasis. Meanwhile, inhibition of miR-630 showed opposite features.
Conclusion: Taken together, our findings indicate a novel hypoxia-induced HIF-3α and miR-630 regulatory feedback loop contributing to metastasis and progression of cervical cancer cells and suggest that HIF-3α and miR-630 might act as potential biomarkers and therapeutic targets for cervical cancer in the future.
Copyright © 2022 Qiaohui Gao et al.
Conflict of interest statement
The authors declare no competing interests.
Figures

Similar articles
-
Hypoxia-inducible microRNA-224 promotes the cell growth, migration and invasion by directly targeting RASSF8 in gastric cancer.Mol Cancer. 2017 Feb 7;16(1):35. doi: 10.1186/s12943-017-0603-1. Mol Cancer. 2017. PMID: 28173803 Free PMC article.
-
MicroRNA-519d-3p Inhibits Proliferation and Promotes Apoptosis by Targeting HIF-2α in Cervical Cancer Under Hypoxic Conditions.Oncol Res. 2018 Aug 23;26(7):1055-1062. doi: 10.3727/096504018X15152056890500. Epub 2018 Jan 10. Oncol Res. 2018. PMID: 29321085 Free PMC article.
-
MiRNA-646-mediated reciprocal repression between HIF-1α and MIIP contributes to tumorigenesis of pancreatic cancer.Oncogene. 2018 Mar;37(13):1743-1758. doi: 10.1038/s41388-017-0082-2. Epub 2018 Jan 18. Oncogene. 2018. PMID: 29343850
-
How does hypoxia inducible factor-1α participate in enhancing the glycolysis activity in cervical cancer?Ann Diagn Pathol. 2013 Jun;17(3):305-11. doi: 10.1016/j.anndiagpath.2012.12.002. Epub 2013 Feb 1. Ann Diagn Pathol. 2013. PMID: 23375385 Review.
-
Hypoxia-inducible factor 3 biology: complexities and emerging themes.Am J Physiol Cell Physiol. 2016 Feb 15;310(4):C260-9. doi: 10.1152/ajpcell.00315.2015. Epub 2015 Nov 11. Am J Physiol Cell Physiol. 2016. PMID: 26561641 Review.
Cited by
-
Epithelial-mesenchymal plasticity in cancer: signaling pathways and therapeutic targets.MedComm (2020). 2024 Aug 1;5(8):e659. doi: 10.1002/mco2.659. eCollection 2024 Aug. MedComm (2020). 2024. PMID: 39092293 Free PMC article. Review.
-
HIF2-α Expression in CML Patients Receiving Hydroxyurea Prior to Imatinib That Achieved Major Molecular Response (MMR) versus in Those Not Achieving MMR.J Blood Med. 2024 Feb 13;15:61-67. doi: 10.2147/JBM.S436015. eCollection 2024. J Blood Med. 2024. PMID: 38375065 Free PMC article.
-
Polysaccharides of natural products alleviate antibiotic-associated diarrhea by regulating gut microbiota: a review.Arch Microbiol. 2024 Nov 7;206(12):461. doi: 10.1007/s00203-024-04184-0. Arch Microbiol. 2024. PMID: 39508892 Review.
-
MiR-630 Promotes Radioresistance by Induction of Anti-Apoptotic Effect via Nrf2-GPX2 Molecular Axis in Head-Neck Cancer.Cells. 2023 Dec 17;12(24):2853. doi: 10.3390/cells12242853. Cells. 2023. PMID: 38132173 Free PMC article.
-
MicroRNAs as Potential Biomarkers in Gynecological Cancers.Biomedicines. 2023 Jun 13;11(6):1704. doi: 10.3390/biomedicines11061704. Biomedicines. 2023. PMID: 37371799 Free PMC article. Review.
References
-
- Cohen P. A., Jhingran A., Oaknin A., Denny L. Cervical cancer. The Lancet . 2019;393(10167):169–182. - PubMed