

Comprehensive investigation into cuproptosis in the characterization of clinical features, molecular characteristics, and immune situations of clear cell renal cell carcinoma
- PMID: 36275737
- PMCID: PMC9582538
- DOI: 10.3389/fimmu.2022.948042
Comprehensive investigation into cuproptosis in the characterization of clinical features, molecular characteristics, and immune situations of clear cell renal cell carcinoma
Abstract
Background: Copper-induced cell death has been widely investigated in human diseases as a form of programmed cell death (PCD). The newly recognized mechanism underlying copper-induced cell death provided us creative insights into the copper-related toxicity in cells, and this form of PCD was termed cuproptosis.
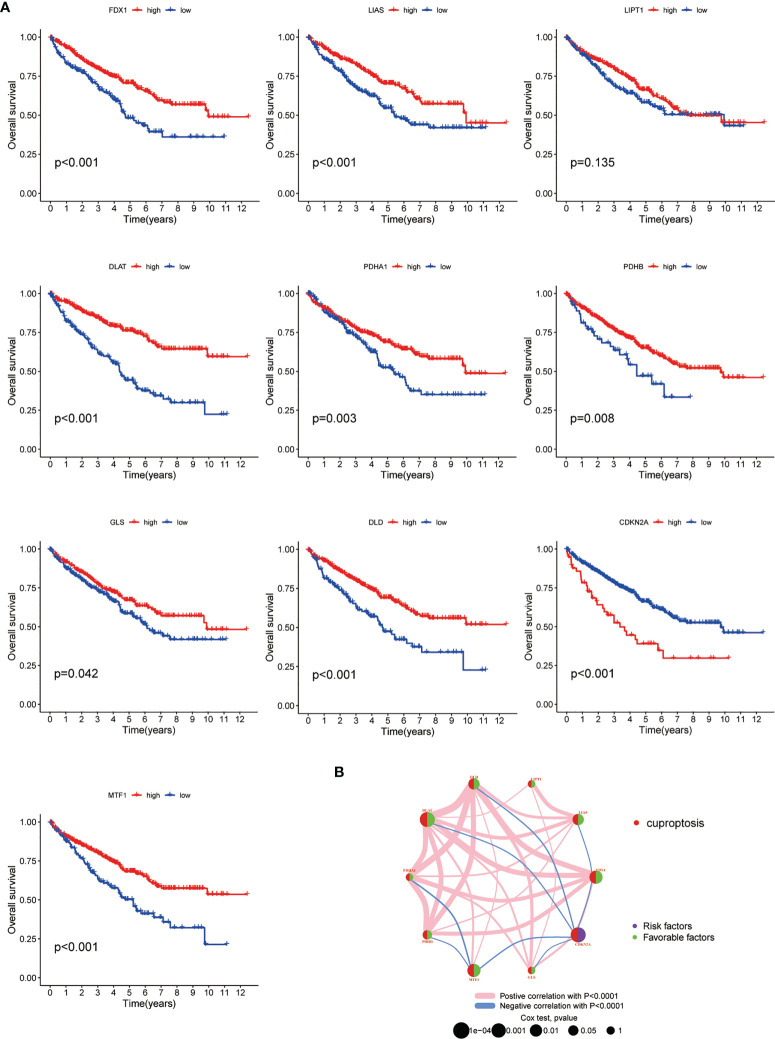
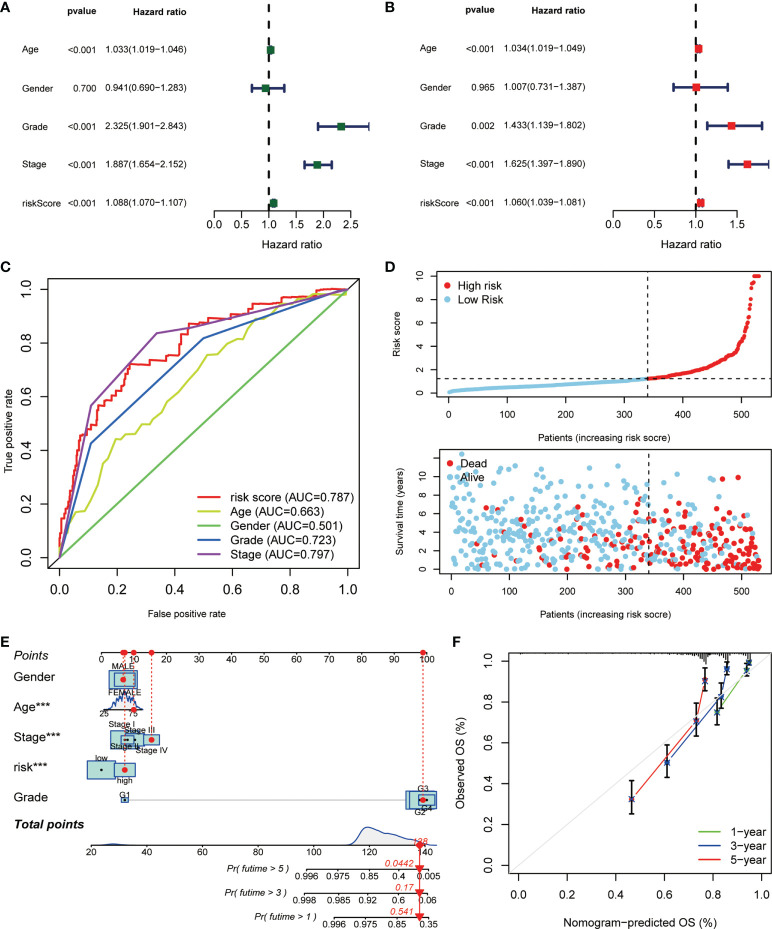
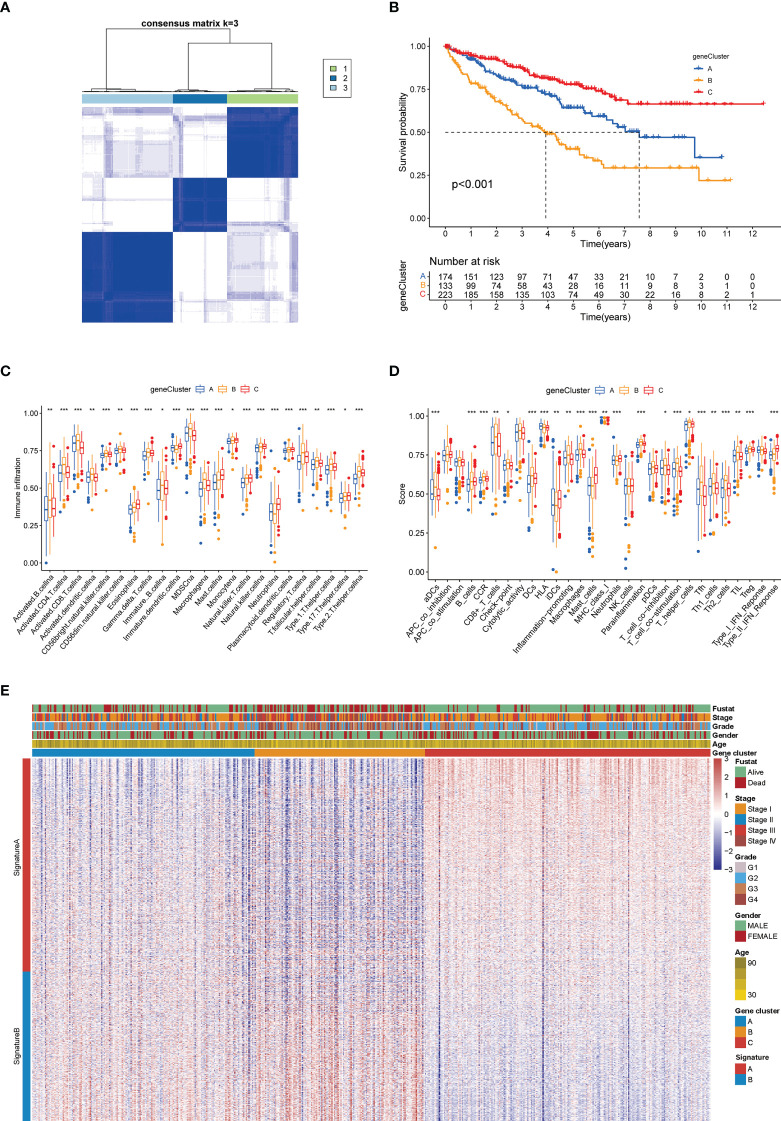
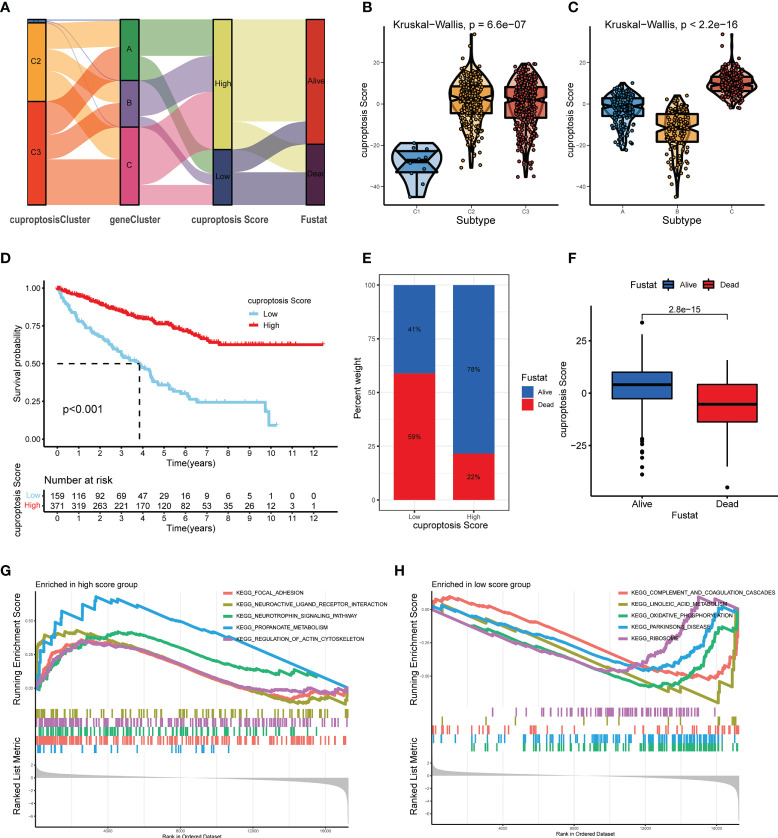
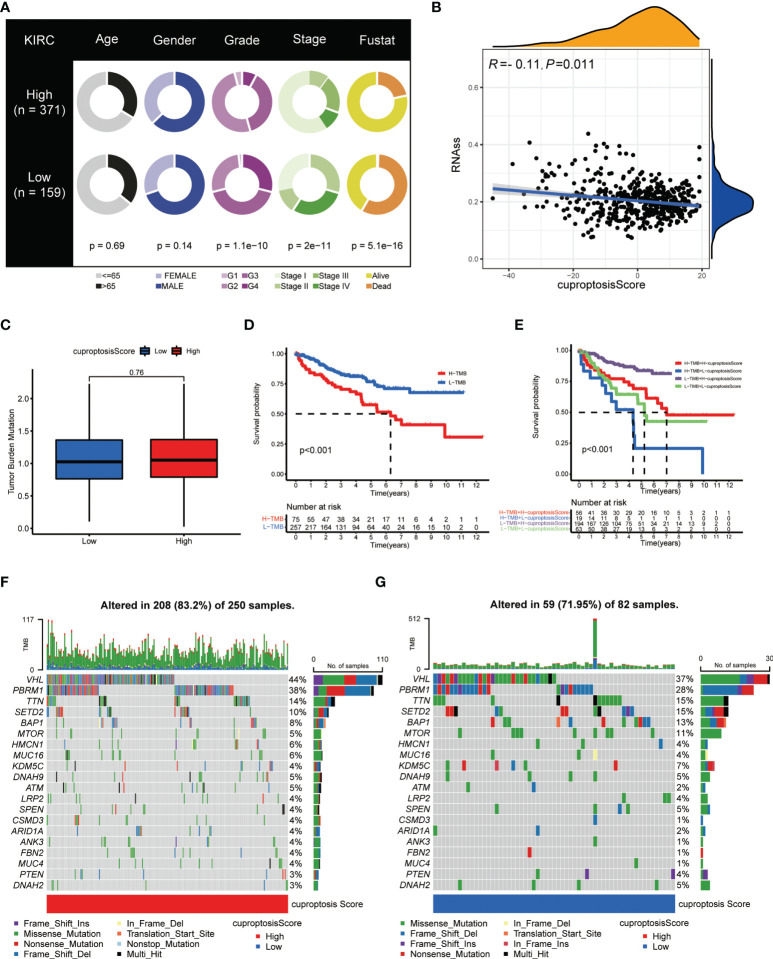
Methods: Through consensus clustering analysis, ccRCC patients from TCGA database were classified into different subgroups with distinct cuproptosis-based molecular patterns. Analyses of clinical significance, long-term survival, and immune features were performed on subgroups accordingly. The cuproptosis-based risk signature and nomogram were constructed and validated relying on the ccRCC cohort as well. The cuproptosis scoring system was generated to better characterize ccRCC patients. Finally, in vitro validation was conducted using ccRCC clinical samples and cell lines.
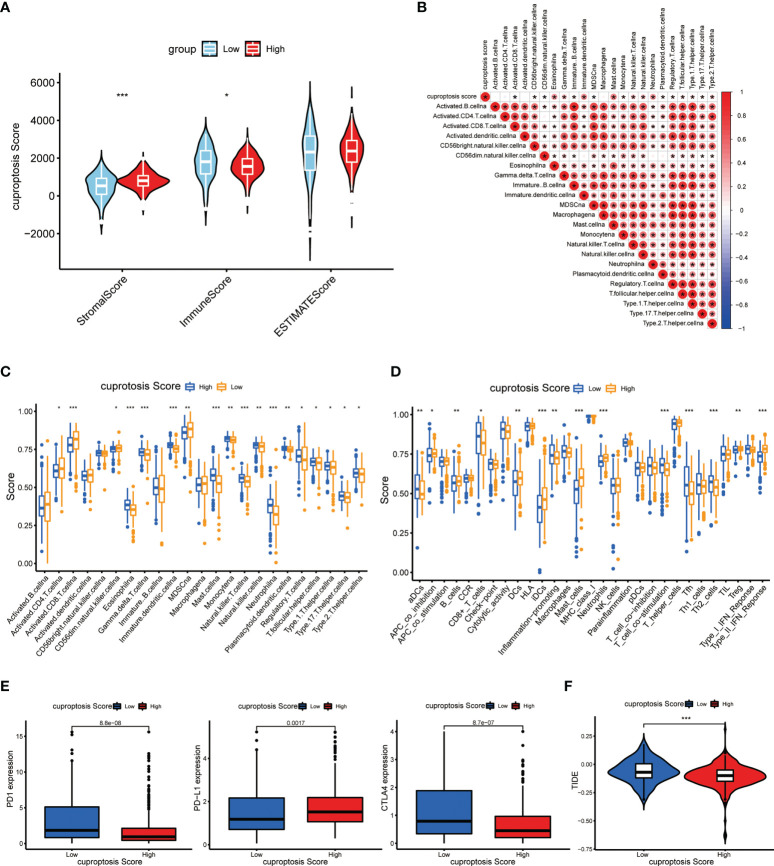
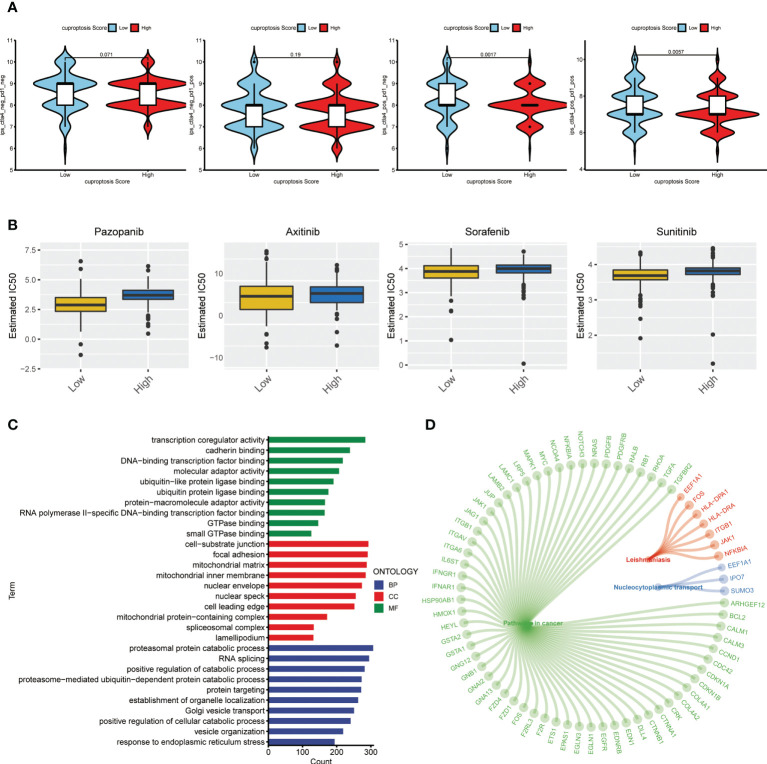
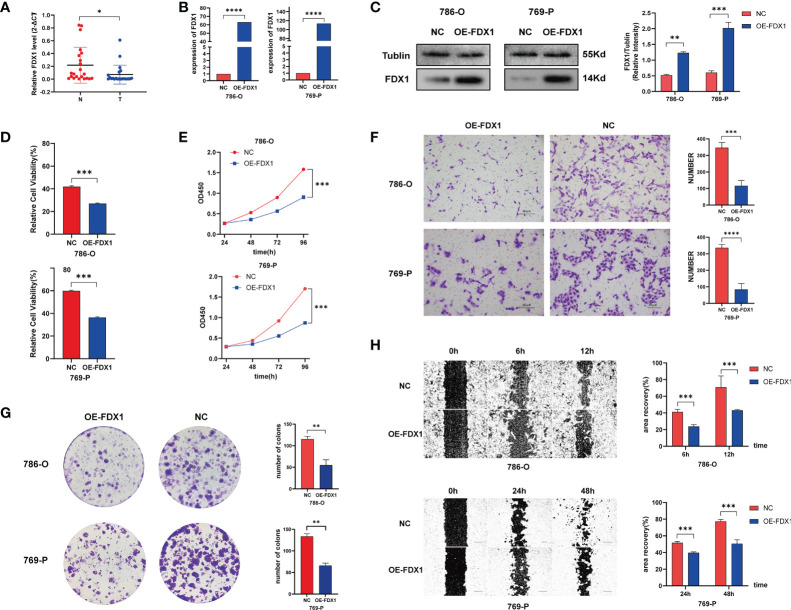
Result: Patients from different subgroups displayed diverse clinicopathological features, survival outcomes, tumor microenvironment (TME) characteristics, immune-related score, and therapeutic responses. The prognostic model and cuproptosis score were well validated and proved to efficiently distinguish the high risk/score and low risk/score patients, which revealed the great predictive value. The cuproptosis score also tended out to be intimately associated with the prognosis and immune features of ccRCC patients. Additionally, the hub cuproptosis-associated gene (CAG) FDX1 presented a dysregulated expression pattern in human ccRCC samples, and it was confirmed to effectively promote the killing effects of copper ionophore elesclomol as a direct target. In vitro functional assays revealed the prominent anti-cancer role of FDX1 in ccRCC.
Conclusion: Cuproptosis played an indispensable role in the regulation of TME features, tumor progression, and long-term prognosis of ccRCC.
Keywords: ccRCC; copper-induced cell death; cuproptosis; immunotherapy; prognosis; tumor microenvironment.
Copyright © 2022 Wang, Song, Wei, Wu, Han, Bu, Tang, Qian and Shao.
Conflict of interest statement
The authors declare that the research was conducted in the absence of any commercial or financial relationships that could be construed as a potential conflict of interest.
Figures


Similar articles
-
A Novel Cuproptosis-Related Prognostic Gene Signature and Validation of Differential Expression in Clear Cell Renal Cell Carcinoma.Genes (Basel). 2022 May 10;13(5):851. doi: 10.3390/genes13050851. Genes (Basel). 2022. PMID: 35627236 Free PMC article.
-
Comprehensive analysis of cuproptosis in immune response and prognosis of osteosarcoma.Front Pharmacol. 2022 Oct 3;13:992431. doi: 10.3389/fphar.2022.992431. eCollection 2022. Front Pharmacol. 2022. PMID: 36263140 Free PMC article.
-
Cuproptosis-Related MiR-21-5p/FDX1 Axis in Clear Cell Renal Cell Carcinoma and Its Potential Impact on Tumor Microenvironment.Cells. 2022 Dec 31;12(1):173. doi: 10.3390/cells12010173. Cells. 2022. PMID: 36611966 Free PMC article.
-
Identification of a novel cuproptosis-related gene signature and integrative analyses in patients with lower-grade gliomas.Front Immunol. 2022 Aug 15;13:933973. doi: 10.3389/fimmu.2022.933973. eCollection 2022. Front Immunol. 2022. PMID: 36045691 Free PMC article. Review.
-
The potential of targeting cuproptosis in the treatment of kidney renal clear cell carcinoma.Biomed Pharmacother. 2023 Nov;167:115522. doi: 10.1016/j.biopha.2023.115522. Epub 2023 Sep 25. Biomed Pharmacother. 2023. PMID: 37757497 Review.
Cited by
-
Cuproptosis related gene PDHB is identified as a biomarker inversely associated with the progression of clear cell renal cell carcinoma.BMC Cancer. 2023 Aug 28;23(1):804. doi: 10.1186/s12885-023-11324-0. BMC Cancer. 2023. PMID: 37641032 Free PMC article.
-
Pan-cancer analysis of oncogenic role of CEP55 and experiment validation in clear cell renal cell carcinoma.Sci Rep. 2024 Nov 16;14(1):28279. doi: 10.1038/s41598-024-80057-2. Sci Rep. 2024. PMID: 39550427 Free PMC article.
-
Mechanisms of cuproptosis and its relevance to distinct diseases.Apoptosis. 2024 Aug;29(7-8):981-1006. doi: 10.1007/s10495-024-01983-0. Epub 2024 Jun 2. Apoptosis. 2024. PMID: 38824478 Review.
-
Machine learning-based on cytotoxic T lymphocyte evasion gene develops a novel signature to predict prognosis and immunotherapy responses for kidney renal clear cell carcinoma patients.Front Immunol. 2023 Jul 31;14:1192428. doi: 10.3389/fimmu.2023.1192428. eCollection 2023. Front Immunol. 2023. PMID: 37600786 Free PMC article.
-
Multiomics Analysis Reveals Cuproptosis-Related Signature for Evaluating Prognosis and Immunotherapy Efficacy in Colorectal Cancer.Cancers (Basel). 2023 Jan 6;15(2):387. doi: 10.3390/cancers15020387. Cancers (Basel). 2023. PMID: 36672336 Free PMC article.
References
Publication types
MeSH terms
Substances
LinkOut - more resources
Full Text Sources
Medical