. 2022 Oct 22;13(1):6301.
doi: 10.1038/s41467-022-34099-7.

Epigenetic control of chromosome-associated lncRNA genes essential for replication and stability

Affiliations

Epigenetic control of chromosome-associated lncRNA genes essential for replication and stability

Michael B Heskett et al. Nat Commun. .

Abstract

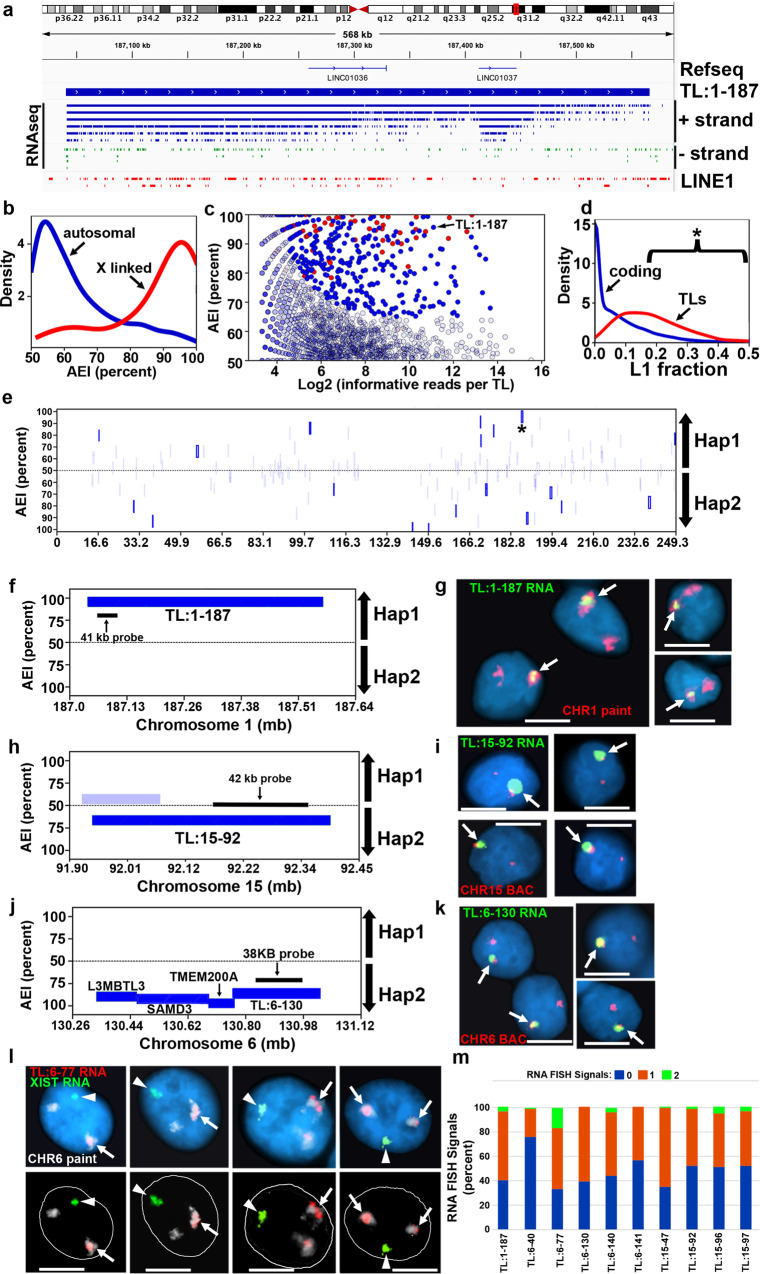
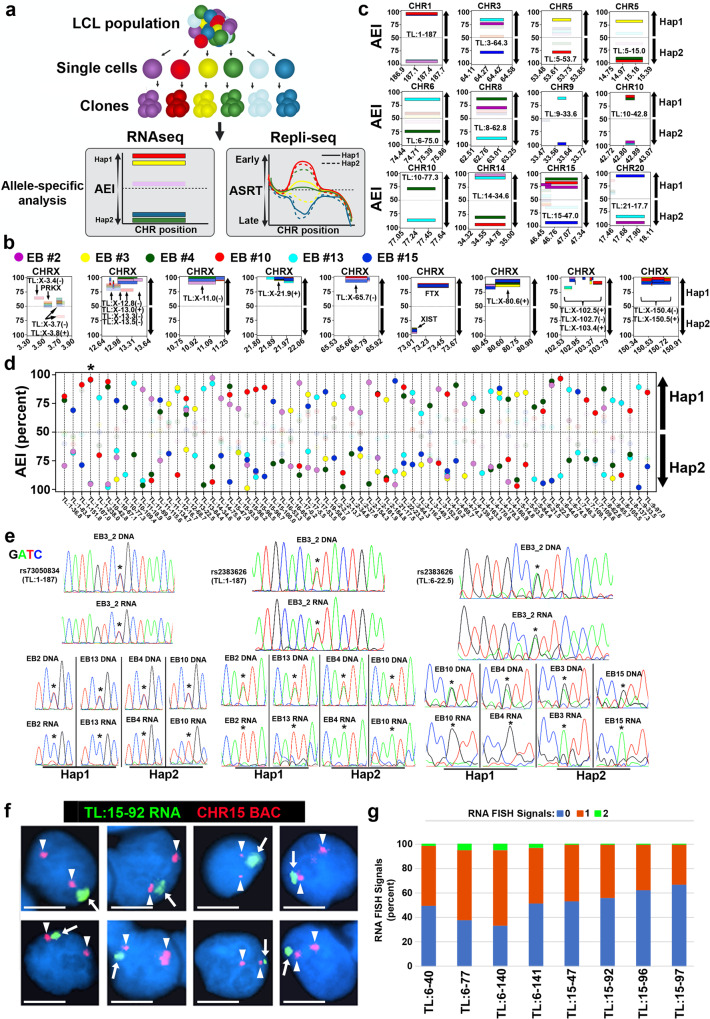
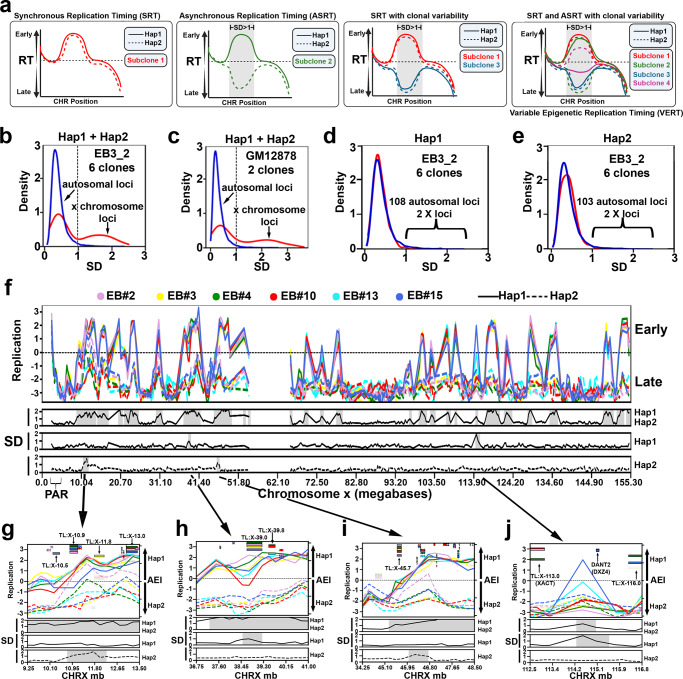
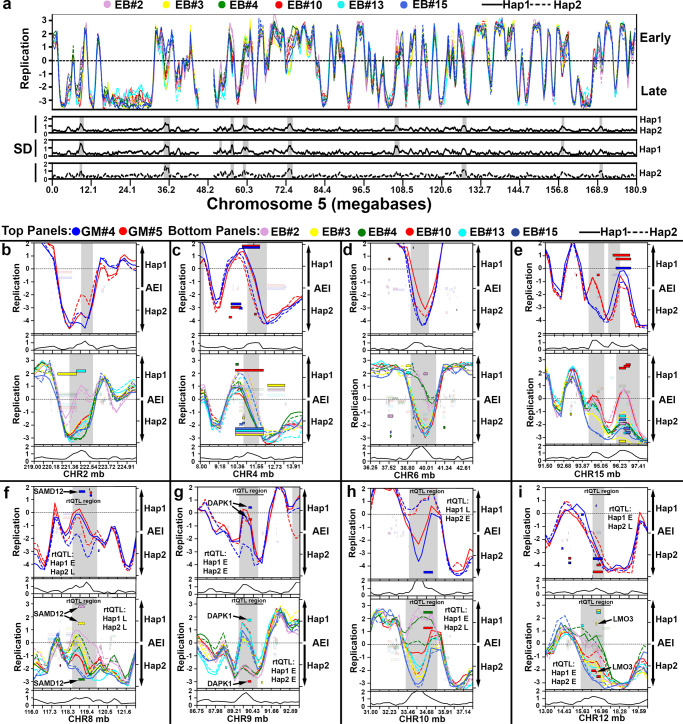
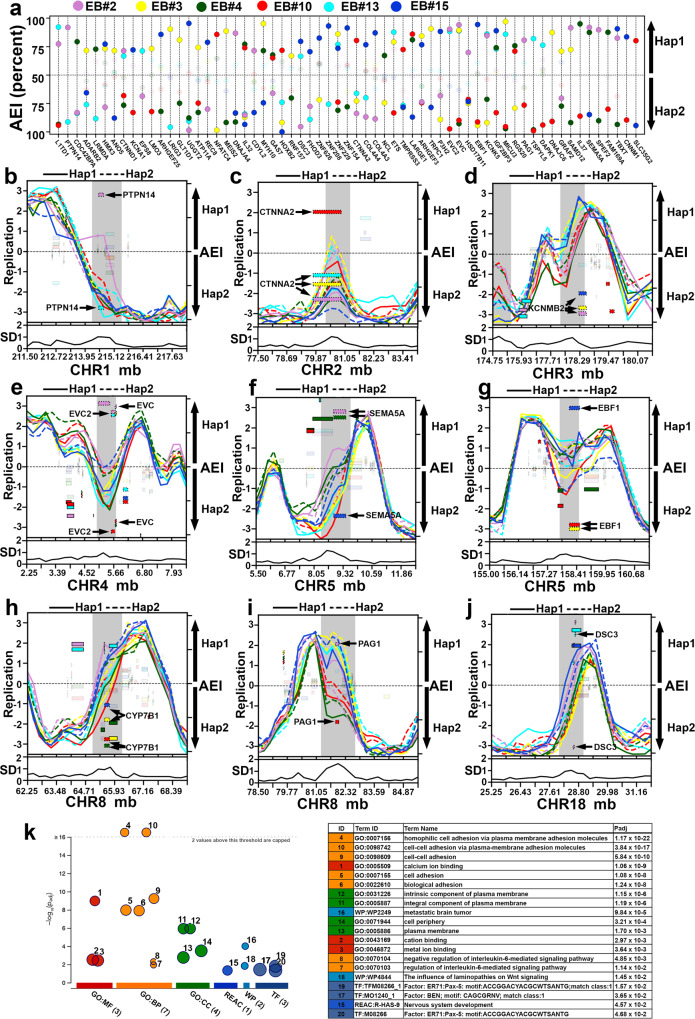
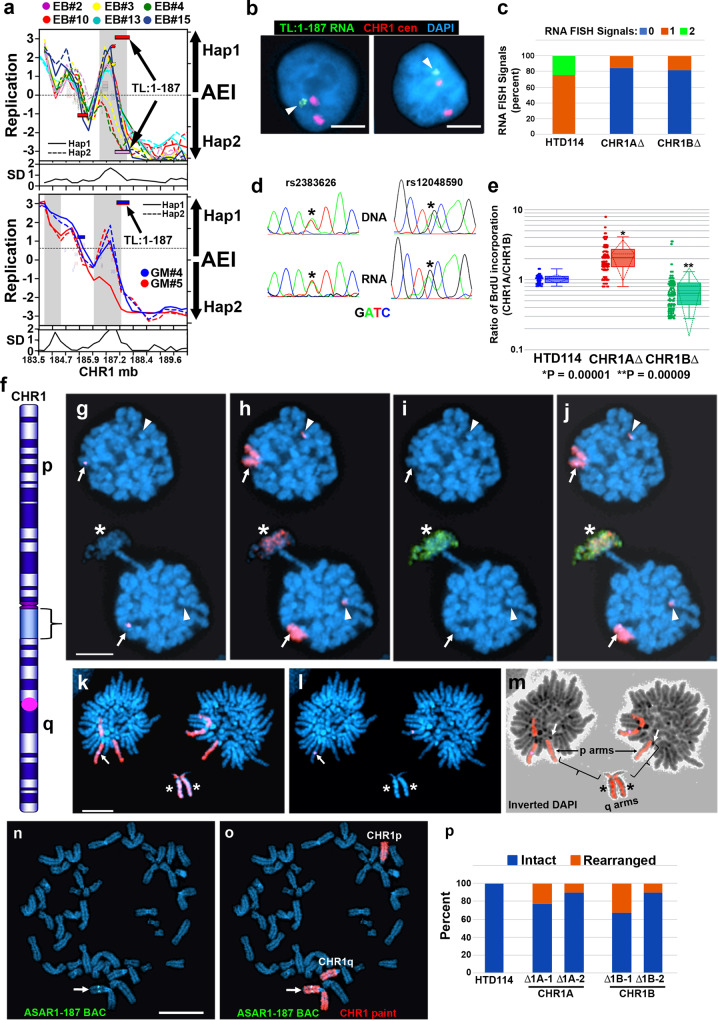
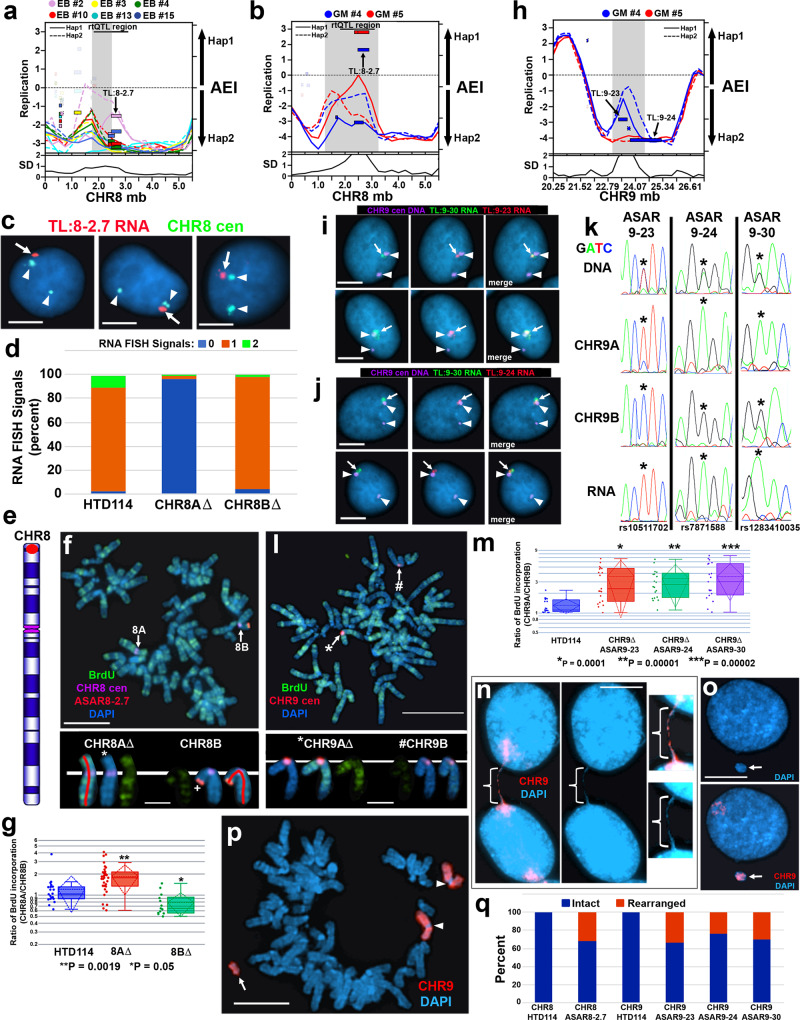
ASARs are long noncoding RNA genes that control replication timing of entire human chromosomes in cis. The three known ASAR genes are located on human chromosomes 6 and 15, and are essential for chromosome integrity. To identify ASARs on all human chromosomes we utilize a set of distinctive ASAR characteristics that allow for the identification of hundreds of autosomal loci with epigenetically controlled, allele-restricted behavior in expression and replication timing of coding and noncoding genes, and is distinct from genomic imprinting. Disruption of noncoding RNA genes at five of five tested loci result in chromosome-wide delayed replication and chromosomal instability, validating their ASAR activity. In addition to the three known essential cis-acting chromosomal loci, origins, centromeres, and telomeres, we propose that all mammalian chromosomes also contain "Inactivation/Stability Centers" that display allele-restricted epigenetic regulation of protein coding and noncoding ASAR genes that are essential for replication and stability of each chromosome.


Conflict of interest statement

The authors declare no competing interests.

Figures

Fig. 1
Fig. 1. Genome-wide allelic expression imbalance and spatial retention patterns of TL in GM12878.
a Genome browser view of a representative example of an intergenic non-coding contiguously transcribed locus on the plus strand of chromosome 1. The location of TL:1-187 with 436,832 independent RNA-seq reads from the plus strand (+ strand; blue) and 592 RNA-seq reads from the minus strand (− strand; green) are shown. The location of 221 LINE1 sequences, totaling 153,348 bp, representing ~28% of the transcribed sequence are shown in red. b Genome-wide distribution of AEI of TLs on all autosomes (blue) and the X chromosome (red). We define AEI as an allelic-bias that is outlying parametric (FDR-Benjamini–Hochberg corrected binomial test q-value < =0.01) and non-parametric (allelic-bias > =2.5 S.D. above autosome-wide mean, controlled for expression level) estimation of the null-distribution of bi-allelic expression. c Scatter plot of AEI of autosomal TL (blue dots) and X-linked TL (red dots) as a function of the number of informative reads. Opaque dots are outliers on the genome-wide distribution of AEI. d Distribution of the fraction of L1 derived sequence in TL and coding genes. The bracket and * highlight TLs with >18% L1 sequence. e Chromosome 1 view of AEI of TL (opaque: statistically significant). The position of TL:1-187 is shown (*). f, h, j Zoom-in views of AEI of representative TL (dark blue = statistically significant; light blue not significant). The location and size of Fosmid probes (see Supplementary Data 2) used for RNA FISH are shown. g, i, k RNA-DNA FISH images of TL:1-187, TL:15-92, and TL:6-130 expression in single cells. l RNA-DNA FISH image of TL:6-77 RNA (red), CHR6 DNA (chromosome paint, white), and XIST RNA (green) visualized within individual cells, top and bottom panels represent the same four cells with the nuclear outline drawn in white. m Percent of XIST positive nuclei exhibiting strong AEI of nine representative TLs, as measured by DNA/RNA FISH visualization (Percent of nuclei with 0, 1 or 2 RNA hybridization signals). Source data are provided as a Source data file.
Fig. 2
Fig. 2. Haplotype resolved analysis of allelic expression imbalance of TL RNAs.
a Sub-cloning and allele-specific genomic analysis scheme for 6 clones from the EB3_2 lymphoblastoid cell line. The left panel shows phased RNA-seq data at one hypothetical TL showing AEI in different clones. The right panel shows the phased Repli-seq data at one hypothetical replication domain showing synchronous or asynchronous replication. b, c Zoom-in views of examples of TL RNAs that display AEI (Hap1: haplotype 1, Hap2: haplotype 2) on the Y axis and the genomic positions (megabases) for the X chromosome (CHRX; panel b) or autosomes (panel c) positions are shown on the X axis. TL and protein coding genes are labeled and marked by arrows. The panel at ~3.5 mb of the X chromosome shows bi-allelic expression of PRKX, a known escape gene, and three bi-allelic TL. c Each panel represents the AEI and location of a prominent TL from 9 different autosomes (CHR1, etc). d All TL RNAs that display AEI from different alleles within the 6 EB3_2 clones (X-axis: chromosome start-position; Y-axis: AEI as percent). The asterisk marks TL:1-187. e Sanger sequencing traces of PCR products generated from genomic DNA and cDNA illustrating heterozygosity in genomic DNA and mono-allelic expression of either allele from TL RNAs (EB3_2: parent cell population, EB2, 3, 4, 10, 13, and 15: clones). f RNA-DNA FISH in PBLs using a Fosmid probe to TL:15-92 to detect RNA and a chromosome 15 BAC to detect DNA. g Expression of TL in female PBLs. Quantification of the number of RNA FISH signals (shown 0, 1, or 2) for 8 different TL in nuclei that contained a single XIST RNA FISH signal. In the nuclei with TL hybridization signals, we detected >80% of nuclei with single sites of TL RNA hybridization for all 8 TLs. Source data are provided as a Source data file.
Fig. 3
Fig. 3. Haplotype resolved analysis of asynchronous replication timing.
a Illustration of a hypothetical genomic region with synchronous replication timing (SRT), asynchronous replication timing (ASRT), and possible clonal variability in both SRT and ASRT. Outliers in the standard deviation (SD) are highlighted in gray. b, c Genome-wide distribution of the SD of the combined RT of individual alleles among clones derived from EB3_2 (12 alleles) and GM12878 (4 alleles). d, e Genome-wide distribution of the SD of the allele restricted replication timing of each individual allele among clones derived from EB3_2 (d: 6 Hap1 alleles; e: 6 Hap2 alleles). Outliers were identified as: SD ≥ 2.5x SD + mean: >0.96 for Hap 1 and >0.98 for Hap 2 in the EB3_2 clones and >0.92 for Hap 1 and >0.94 for Hap 2 in the GM12878 clones. f Chromosome X Early/Late RT profile with SD of haplotype-resolved replication timing from the 6 EB3_2 clones highlighting (gray shading) outlier regions from the “combined RT profile” (Hap1 plus Hap2) and from the “allele-restricted RT profile” separately (Hap1 or Hap2). Each clone was color coded as shown, with haplotype 1 shown as a solid line, and haplotype 2 shown as a dotted line for both sets of clones. The left axis shows the RT profiles, with positive numbers representing early replication and negative numbers representing late replication. gj Zoom in views of the 4 locations that contain outliers in SD of the “allele-restricted RT profiles”. Each clone was color coded as shown, with haplotype 1 shown as a solid line, and haplotype 2 shown as a dotted line for both sets of clones. The left Y axis shows the Early/Late RT profiles. The SD of the replication timing across each locus is shown below each panel. Areas highlighted in gray represent outliers in the SD. The right Y axis shows the AEI, with smooth rectangles representing TL and the stippled rectangles representing protein coding genes. The opaque rectangles show AEI, while the transparent rectangles show bi-allelic expression of TL and protein coding regions.
Fig. 4
Fig. 4. Haplotype phased analysis of ASRT on autosomes.
a Chromosome 5 RT profile from the 6 EB3_2 clones, highlighting regions with standard deviation (SD) > 1 from both the “combined allele RT profile” (Hap1 and Hap2) and from the “allele-restricted RT profile” separately (Hap1 or Hap2). bi Representative examples of regions present in both GM12878 (top panels) and EB3_2 (bottom panels) clones with variable epigenetic replication timing between alleles. Each clone was color coded as shown, with haplotype 1 shown as a solid line, and haplotype 2 shown as a dotted line for both sets of clones. The left Y axis shows the replication timing (Early/Late) profiles. The SD of the replication timing across each locus is shown below each panel. The right Y axis shows the AEI, with smooth rectangles representing TL and the stippled rectangles representing protein coding genes. The opaque rectangles show AEI, while the transparent rectangles show bi-allelic expression of TL and protein coding regions. Chromosome number and genomic positions (megabases) are shown on the X axis. Areas highlighted in gray represent outliers in the SD. fi The location of rtQTL at VERT regions, with the Early (E) and Late (L) alleles for both GM12878 and EB3_2 are shown (also see Supplementary Data 5).
Fig. 5
Fig. 5. Haplotype resolved expression and replication of protein coding genes.
a 63 protein coding genes display random epigenetic AEI in EB3_2 clones (X-axis: protein coding gene; Y-axis: AEI). bj Examples of genomic regions that contain protein coding genes that display epigenetic AEI and VERT in the six EB3_2 clones. The left axis shows the replication timing (Early/Late) profiles, and the standard deviation (SD) across each locus is shown below each panel. Outliers in the standard deviation (SD) are highlighted in gray. The right Y-axis shows the AEI, with the stippled rectangles representing protein coding genes and smooth rectangles representing TL. The opaque rectangles show AEI (FDR-BH alpha < =0.01), while the transparent rectangles show bi-allelic expression of protein coding and non-coding transcripts. Chromosome number and genomic positions (megabases) are shown on the X axis. k Functional enrichment analysis of coding genes that display random epigenetic AEI in EB3_2 clones.
Fig. 6
Fig. 6. Delayed replication following disruption of TL:1-187.
a AEI and ASRT at TL:1-187 in EB3_2 (top) and GM12878 (bottom) clones. The left Y-axis shows replication profiles and the standard deviation (SD). The right Y-axis shows AEI, haplotype 1 (Hap1), and haplotype 2 (Hap2). Outliers in the standard deviation (SD) are highlighted in gray. Chromosome position (megabases) is shown on the X axis. Smooth rectangles represent TL, stippled rectangles represent coding genes. Opaque rectangles show AEI, and transparent rectangles indicate bi-allelic expression. b RNA-DNA FISH using a TL:1-187 probe (green) to detect RNA and a chromosome 1 centromeric (red) probe to detect DNA. Arrowheads mark the RNA hybridization. c Quantification of the RNA signals for TL:1-187 in HTD114. An RNA FISH probe to an intron of KCNQ5 served as positive control. d Sequencing traces of PCR products at heterozygous SNPs (asterisks) within TL:1-187. e Ratio of BrdU incorporation in chromosome 1A divided by chromosome 1B in cells with heterozygous deletions of TL:1-187. Box plots indicate mean (solid line), standard deviation (dotted line), 25th, 75th percentile (box) and 5th and 95th percentile (whiskers) and individual cells (single points). P values were calculated using the Kruskal–Wallis test. Values for individual cells are shown as dots. f Chromosome 1 showing the short (p) and long (q) arms, G-bands, heterochromatic block (bracket), and TL:1-187 (purple dot). gj Delayed replication and condensation following deletion of TL:1-187. BrdU incorporation (green) and DNA FISH using a chromosome 1 paint (red) plus a TL:1-187 BAC (purple). A chromosome 1 translocation is marked with arrowheads. km DNA FISH using a chromosome 1 paint (red) plus the TL:1-187 BAC (purple, arrows). The lagging chromosome lacks the TL:1-187 BAC (asterisks). The short (p) and long (q) arms of the lagging chromosome are indicated, and arrows in panel m mark the centromeres of the lagging chromosome. n, o Chromosome following TL:1-187 deletion. DNA FISH using the TL:1-187 BAC (green) and a chromosome 1 paint (red). Scale bars are 10 µM. p Quantification of chromosome 1 rearrangements. c, e, p Source data are provided as a Source data file.
Fig. 7
Fig. 7. Delayed replication and instability.
Deletions of TL:8-2.7 (ag) or TL:9-23, TL:9-24, or TL:9-30 (hp). a, b, h AEI and ASRT in EB3_2 and GM12878 clones. The left Y-axis shows replication, and standard deviation (SD). Outliers in the standard deviation (SD) are highlighted in gray. The right Y-axis shows AEI. The X axis shows chromosome position (megabases). c FISH for TL:8-2.7 RNA (red, arrows) and chromosome 8 centromere DNA (green, arrowheads). d Quantification of RNA signals for TL:8-2.7 before and after deletion. Percent of nuclei with 0, 1, or 2 signals are shown. e Chromosome 8 showing the location of TL:8-2.7 (red dot). f Delayed replication following ASAR8-2.7 deletion. BrdU incorporation (green) and DNA FISH (CHR8 cen, purple) plus an ASAR8-2.7 Fosmid (red). g, m Quantification of BrdU incorporation following ASAR8-2.7 (g) or ASAR9-23, ASAR9-24, or ASAR9-30 (m) deletion. Box plots indicate mean (solid line), standard deviation (dotted line), 25th, 75th percentile (box), 5th and 95th percentile (whiskers) and individual cells (single points). P values were calculated using the Kruskal–Wallis test. i, j RNA-DNA FISH for TL:9-30 RNA (green, arrows) and TL:9-23 RNA (i) or TL:9-24 RNA (j) (red, arrows) and chromosome 9 centromere DNA (purple, arrowheads). k Sequencing traces of PCR products from DNA or cDNA (RNA) isolated from HTD114, and DNA from cell hybrids containing either CHR9A or CHR9B. l ASRT after deletion of ASAR9-23. Mitotic cell showing BrdU incorporation (green) and DNA FISH (CHR9 centromere; red). np DNA FISH using chromosome 9 paint (CHR9; red). m Deletions of ASAR9-23, ASAR9-24 or ASAR9-30 were from chromosome 9A (*CHR9A). n The bracket marks a chromosome bridge, and insets show longer exposures. o Micronucleus containing chromosome 9. p Mitotic cell containing a chromosome 9 fragment. Arrowheads mark intact chromosome 9 s. Scale bars are 10 µM (c, f, ij, l, np), and 2.5 µM in insets in (f) and (l). q Percent cells containing rearrangements identified with chromosome paints. Deleted ASARs are indicated, and chromosomes 8 and 9 were scored in parental HTD114 cells. Source data are provided as a Source data file (d, g, m, q).

Similar articles

Cited by

References

    1. Mukhopadhyay R, et al. Allele-specific genome-wide profiling in human primary erythroblasts reveal replication program organization. PLoS Genet. 2014;10:e1004319. doi: 10.1371/journal.pgen.1004319. - DOI - PMC - PubMed
    1. Dileep V, Gilbert DM. Single-cell replication profiling to measure stochastic variation in mammalian replication timing. Nat. Commun. 2018;9:427. doi: 10.1038/s41467-017-02800-w. - DOI - PMC - PubMed
    1. Rivera-Mulia JC, et al. Allele-specific control of replication timing and genome organization during development. Genome Res. 2018;28:800–811. doi: 10.1101/gr.232561.117. - DOI - PMC - PubMed
    1. Donley N, Smith L, Thayer MJ. ASAR15, a cis-acting locus that controls chromosome-wide replication timing and stability of human chromosome 15. PLoS Genet. 2015;11:e1004923. doi: 10.1371/journal.pgen.1004923. - DOI - PMC - PubMed
    1. Heskett MB, Smith LG, Spellman P, Thayer MJ. Reciprocal monoallelic expression of ASAR lncRNA genes controls replication timing of human chromosome 6. RNA. 2020;26:724–738. doi: 10.1261/rna.073114.119. - DOI - PMC - PubMed

Publication types