

Quantitative iTRAQ proteomics reveal the proteome profiles of bone marrow mesenchymal stem cells after cocultures with Schwann cells in vitro
- PMID: 36267768
- PMCID: PMC9577794
- DOI: 10.21037/atm-22-3073
Quantitative iTRAQ proteomics reveal the proteome profiles of bone marrow mesenchymal stem cells after cocultures with Schwann cells in vitro
Abstract
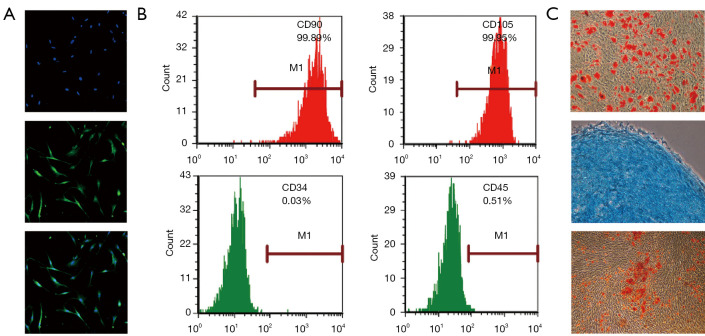
Background: Bone marrow mesenchymal stem cells (BMSCs) combined with Schwann cells (SCs) represent a better therapeutic cell transplantation strategy for treating spinal cord injury (SCI) than transplantation with BMSCs or SCs alone. In previous studies, we demonstrated that BMSCs are able to differentiate in neuron-like cells when cocultured with SCs. The detailed mechanism underlying SCI repair that occurs during the combined transplantation of BMSCs and SCs has not yet been studied. In this study, we adopted an isobaric tag for relative and absolute quantitation (iTRAQ)-based protein identification/quantification approach to examine the effects of the SC and BMSC coculture process on the BMSCs and then obtained and analyzed the differentially expressed proteins (DEPs) and their possible related pathways.
Methods: This study included three groups based on the number of coculture days (i.e., 0, 3, and 7 days). Changes in BMSC protein expression levels were measured using the iTRAQ technique. A bioinformatics analysis of all the data was performed.
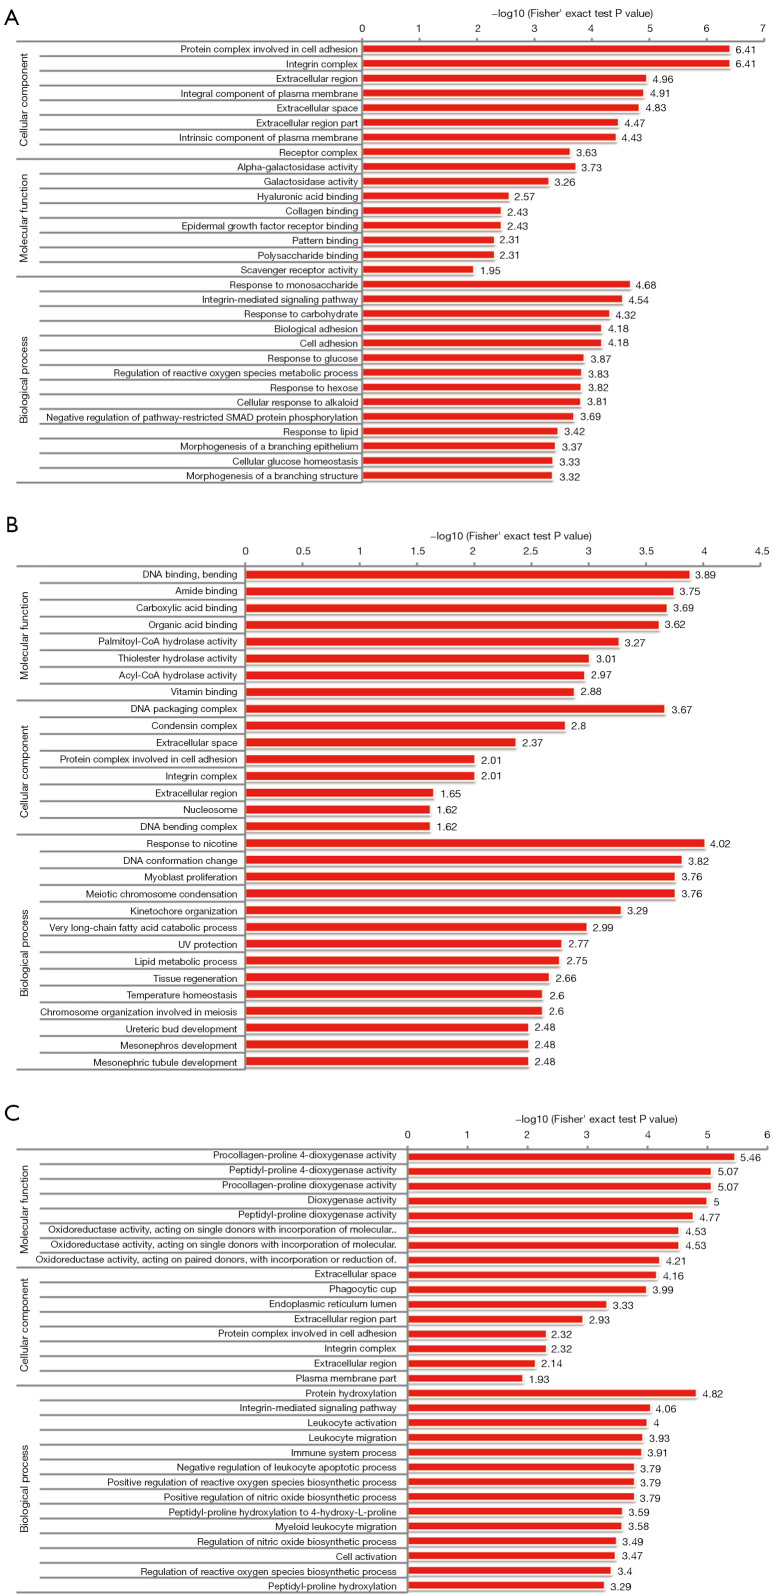
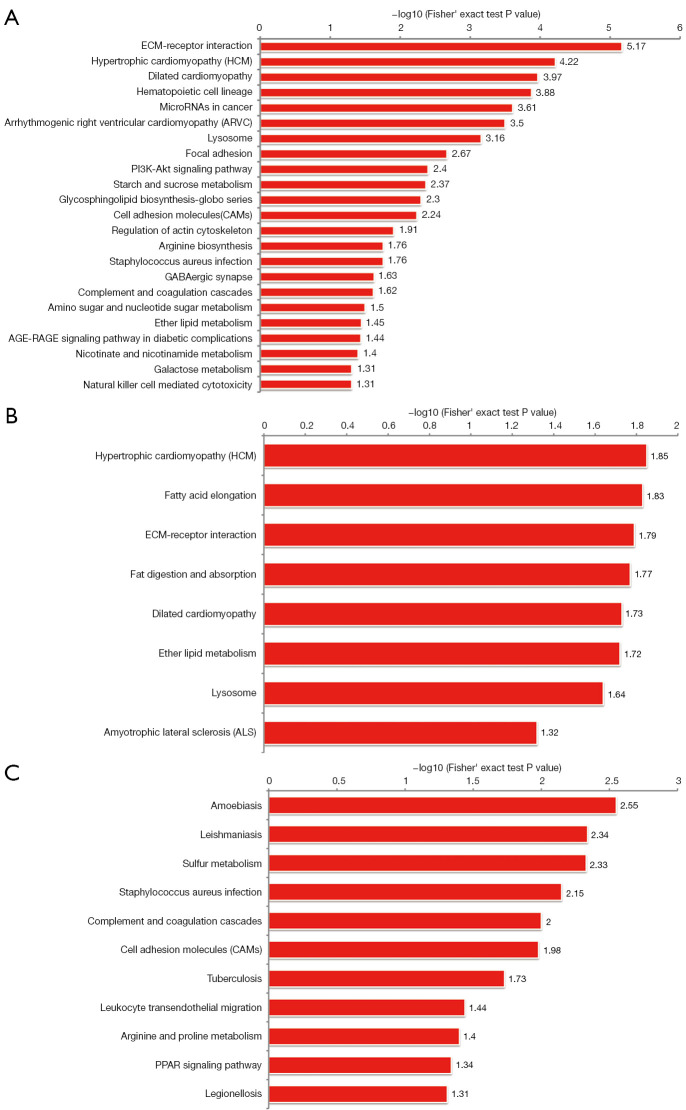
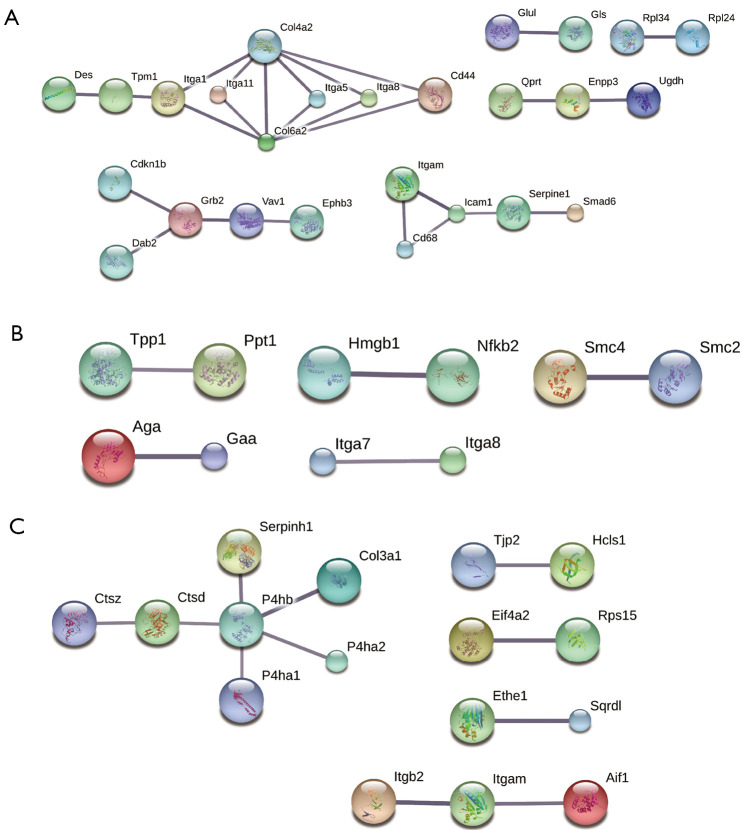
Results: In total, 6,760 types of proteins were detected, corresponding to 5,181 data points with quantitative information. Of these, a total of 243 DEPs were identified, of which 169 proteins were upregulated and 74 proteins were downregulated. These DEPs were identified by Gene Ontology (GO) and Kyoto Encyclopedia of Genes and Genomes (KEGG) analyses. Intercellular adhesion molecule-1 (ICAM-1), integrin, and dioxygenase may play crucial roles in the repair of SCI. The data analysis indicates that the relevant biological processes may be regulated by lysosome function, cell adhesion molecules (CAMs), leukocyte transendothelial migration, and the phosphatidylinositol-3-kinase (PI3K) and peroxisome proliferator-activated receptor (PPAR) signaling pathways.
Conclusions: The data provided in this study indicate that several molecular mechanisms and signaling pathways are involved in the BMSC and SC coculture process. This information may be useful for the further identification of specific targets and related mechanisms and guide new directions for SCI treatment.
Keywords: Proteomics analysis; Schwann cells (SCs); bone marrow mesenchymal stem cells (BMSCs); isobaric tag for relative and absolute quantitation (iTRAQ); spinal cord injury (SCI).
2022 Annals of Translational Medicine. All rights reserved.
Conflict of interest statement
Conflicts of Interest: All authors have completed the ICMJE uniform disclosure form (available at https://atm.amegroups.com/article/view/10.21037/atm-22-3073/coif). The authors have no conflicts of interest to declare.
Figures

Similar articles
-
Isobaric Tagging for Relative and Absolute Protein Quantification (iTRAQ)-Based Quantitative Proteomics Analysis of Differentially Expressed Proteins 1 Week After Spinal Cord Injury in a Rat Model.Med Sci Monit. 2020 Nov 4;26:e924266. doi: 10.12659/MSM.924266. Med Sci Monit. 2020. PMID: 33144554 Free PMC article.
-
Reduction of cystic cavity, promotion of axonal regeneration and sparing, and functional recovery with transplanted bone marrow stromal cell-derived Schwann cells after contusion injury to the adult rat spinal cord.J Neurosurg Spine. 2008 Dec;9(6):600-10. doi: 10.3171/SPI.2008.9.08135. J Neurosurg Spine. 2008. PMID: 19035756
-
Combination of activated Schwann cells with bone mesenchymal stem cells: the best cell strategy for repair after spinal cord injury in rats.Regen Med. 2011 Nov;6(6):707-20. doi: 10.2217/rme.11.32. Regen Med. 2011. PMID: 22050523
-
In vitro differentiation of bone marrow mesenchymal stem cells into endometrial epithelial cells in mouse: a proteomic analysis.Int J Clin Exp Pathol. 2014 Jun 15;7(7):3662-72. eCollection 2014. Int J Clin Exp Pathol. 2014. PMID: 25120742 Free PMC article.
-
Schwann cell transplantation for spinal cord injury repair: its significant therapeutic potential and prospectus.Rev Neurosci. 2015;26(2):121-8. doi: 10.1515/revneuro-2014-0068. Rev Neurosci. 2015. PMID: 25581750 Review.
Cited by
-
Proteomic Insights into Osteoporosis: Unraveling Diagnostic Markers of and Therapeutic Targets for the Metabolic Bone Disease.Biomolecules. 2024 May 4;14(5):554. doi: 10.3390/biom14050554. Biomolecules. 2024. PMID: 38785961 Free PMC article. Review.
References
LinkOut - more resources
Full Text Sources
Miscellaneous