. 2022 Nov;611(7936):519-531.
doi: 10.1038/s41586-022-05325-5. Epub 2022 Oct 19.

Semi-automated assembly of high-quality diploid human reference genomes

Erich D Jarvis #  1   2 Giulio Formenti #  3 Arang Rhie  4 Andrea Guarracino  5 Chentao Yang  6 Jonathan Wood  7 Alan Tracey  7 Francoise Thibaud-Nissen  8 Mitchell R Vollger  9 David Porubsky  9 Haoyu Cheng  10   11 Mobin Asri  12 Glennis A Logsdon  9 Paolo Carnevali  13 Mark J P Chaisson  14 Chen-Shan Chin  15 Sarah Cody  16 Joanna Collins  7 Peter Ebert  17 Merly Escalona  18 Olivier Fedrigo  19 Robert S Fulton  16 Lucinda L Fulton  16 Shilpa Garg  20 Jennifer L Gerton  21 Jay Ghurye  22 Anastasiya Granat  23 Richard E Green  12 William Harvey  9 Patrick Hasenfeld  24 Alex Hastie  25 Marina Haukness  12 Erich B Jaeger  23 Miten Jain  12 Melanie Kirsche  26 Mikhail Kolmogorov  27 Jan O Korbel  24 Sergey Koren  4 Jonas Korlach  28 Joyce Lee  25 Daofeng Li  29   30 Tina Lindsay  16 Julian Lucas  12 Feng Luo  31 Tobias Marschall  17 Matthew W Mitchell  32 Jennifer McDaniel  33 Fan Nie  34 Hugh E Olsen  12 Nathan D Olson  33 Trevor Pesout  12 Tamara Potapova  21 Daniela Puiu  35 Allison Regier  36 Jue Ruan  37 Steven L Salzberg  35 Ashley D Sanders  38 Michael C Schatz  26 Anthony Schmitt  39 Valerie A Schneider  8 Siddarth Selvaraj  39 Kishwar Shafin  12 Alaina Shumate  35 Nathan O Stitziel  16   29   40 Catherine Stober  24 James Torrance  7 Justin Wagner  33 Jianxin Wang  34 Aaron Wenger  28 Chuanle Xiao  41 Aleksey V Zimin  35 Guojie Zhang  42 Ting Wang  16   29   30 Heng Li  10 Erik Garrison  43 David Haussler  44   45 Ira Hall  46 Justin M Zook  33 Evan E Eichler  44   9 Adam M Phillippy  4 Benedict Paten  12 Kerstin Howe  47 Karen H Miga  48 Human Pangenome Reference Consortium
Affiliations

Semi-automated assembly of high-quality diploid human reference genomes

Erich D Jarvis et al. Nature. 2022 Nov.

Abstract

The current human reference genome, GRCh38, represents over 20 years of effort to generate a high-quality assembly, which has benefitted society1,2. However, it still has many gaps and errors, and does not represent a biological genome as it is a blend of multiple individuals3,4. Recently, a high-quality telomere-to-telomere reference, CHM13, was generated with the latest long-read technologies, but it was derived from a hydatidiform mole cell line with a nearly homozygous genome5. To address these limitations, the Human Pangenome Reference Consortium formed with the goal of creating high-quality, cost-effective, diploid genome assemblies for a pangenome reference that represents human genetic diversity6. Here, in our first scientific report, we determined which combination of current genome sequencing and assembly approaches yield the most complete and accurate diploid genome assembly with minimal manual curation. Approaches that used highly accurate long reads and parent-child data with graph-based haplotype phasing during assembly outperformed those that did not. Developing a combination of the top-performing methods, we generated our first high-quality diploid reference assembly, containing only approximately four gaps per chromosome on average, with most chromosomes within ±1% of the length of CHM13. Nearly 48% of protein-coding genes have non-synonymous amino acid changes between haplotypes, and centromeric regions showed the highest diversity. Our findings serve as a foundation for assembling near-complete diploid human genomes at scale for a pangenome reference to capture global genetic variation from single nucleotides to structural rearrangements.


Conflict of interest statement

E.E.E. was a scientific advisory board member of Variant Bio, Inc. J.K. and A.W. were full-time employees at Pacific Biosciences, a company developing single-molecule sequencing technologies. A.H. and J. Lee. were employees of Bionano Genomics, a company developing optical maps for genome assembly. J.G. and R.E.G. were affiliated with Dovetail Genomics, a company developing genome assembly tools, including Hi-C. A. Granat and E.B.J. were employees of Ilumina, Inc., a genome company generating short reads. A. Schmitt and S.S. were employees of Arima Genomics, a company developing Hi-C data for genome assemblies. All other authors declare no competing interests.

Figures
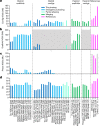
Fig. 1
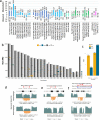
Fig. 1. Assembly continuity, phasing and base call accuracy metrics.
a, Contig NG50 values. b, Scaffold NG50 values. c, Haplotype phase block NG50 values. d, QV base call accuracy; as an example, QV60 is about one error per megabase. The dashed lines separate the assemblies into the four major categories as described in Table 1. The colours designate the type of haplotype phasing performed: Trio phasing using parental data, endogenous phasing using self-data, partial endogenous phasing, merging of haplotypes, and final references with various phasing approaches. The grey shaded regions in b are not applicable for scaffold metrics, as these are contig-only assemblies; however, the Flye assembler inserts gaps into contigs where there is uncertainty of a repeat sequence, and the purge_dups function applied to the HiCanu contigs removes false duplications within contigs and creates a gap in the removed location. The grey shading in c indicates not applicable for phase blocks, because GRCh38 has many haplotypes and CHM13 is from a haploid (hap) cell line. The numbers in parentheses along the x axis are the assembly numbers. alt, alternate; mat, maternal; pat, paternal; phap, psuedo-haplotype; pri, primary; std., standard ONT read length; S-seq., Strand-Seq; UL., ultra-long ONT read length.
Fig. 2
Fig. 2. Multidimensional relationship among assemblies.
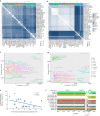
a,b, Clustering of pairwise Jaccard similarities between pairs of assemblies, for the autosomes 1–22 (a) and the X and Y sex chromosomes (b). In the heatmap, the lighter the blue (Jaccard similarity index closer to 1), the more similar the assemblies (1 indicates identical assemblies). Assemblies are annotated with four different colour-coded classifications. c,d, PCA on the multidimensional Euclidean distances among assemblies, for the autosomes 1–22 (c) and the X and Y sex chromosomes (d). PCA dimensions shown are those in which the paternal and maternal haplotypes separated the strongest. e, Correlation between centromere size relative to chromosome size (%) and PCA variance (%) in the dimension where the Trio-based autosome assemblies separated by haplotype. f, Graph-based alignment of a 5-Mb region of human chromosome 6 containing the MHC locus of the Trio-based assemblies and GRCh38 and CHM13 references. Each colour is a different assembled haplotype. The Trio hifiasm assembly and the final HG002 assembly that used Trio hifiasm assembled the entire MHC locus in one single contig.
Fig. 3
Fig. 3. Near-complete haplotype separation of scaffolds.
a, Hi-C contact maps to the final curated HPRC-HG002 paternal (left) and maternal (middle) assemblies in comparison to the CHM13 assembly (right). Values designate chromosome numbers, from largest to smallest size for each assembly. b, Blob plot using Illumina parental k-mers for the scaffolds of the HPRC-HG002 haplotypes. c, Percent size of HG002 diploid assembled chromosomes relative to CHM13 chromosomes, without including Ns. d, Comparison of absolute chromosome size values of all three assemblies, without including Ns. e, Number of remaining gaps in the chromosomes of each HG002 haplotype. Asterisks indicate assembled contigs with no gaps: maternal chromosomes 11 and 12, and assembled paternal chromosomes 21 and 22 without complete short arms.
Fig. 4
Fig. 4. HPRC-HG002 features.
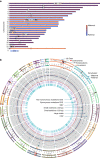
a, Chromosome alignments between HPRC-HG002 maternal (top) and paternal (bottom) assemblies and CHM13 and the Y chromosome of GRCh38. Haplotype separation is nearly complete, and thus colours are solid blue (paternal) and red (maternal). Colour values were determined by the number of aligned haplotype-specific k-mers. A few ambiguous alignment blocks (purple) are highly repetitive regions, where it is hard to extract enough haplotype-specific k-mers. The black tick marks indicate gaps between contigs. Unaligned regions, which are mostly centromeric satellites, are shown in grey. b, Circos plot of the heterozygosity landscape between the two HG002 haploid assemblies. Tracks from inside out: synonymous amino acid changes; non-synonymous changes; SNV density (window size of 500 kb, range of 0–3.1%), and small deletion and small insertion (less than 50 bp) density (window size of 1 Mb, range of 0–850); large indel density (50 bp or more, window size of 1 Mb, count of 0–20) and copy number variant (CNV) density (window size of 1 Mb, count of 0–77). The black line links in the outermost circles denote intrachromosomal translocations (50 bp or more) between paternal (inner) and maternal (outer) assemblies. The orange bars indicate inversions (50 bp or more), the red bars denote centromeres and the grey triangles indicate gaps. CDS, coding sequence.
Fig. 5
Fig. 5. Genes with no aligned transcript and thus presumed absent in the four main reference assemblies compared.
n refers to the number of genes absent in each reference assembly. Values in the four-way Venn diagram are the number of shared or uniquely absent genes among the four assemblies.
Extended Data Fig. 1
Extended Data Fig. 1. Non-human and organelle genomes found in the human genome assemblies.
a, The number of contigs that had remaining library clone vector sequences in each assembly. Medium used a blastn score 19-29; strong a score > 30 https://www.ncbi.nlm.nih.gov/tools/vecscreen/about/. b, The number of contigs with non-human yeast and E.coli sequences. Values above columns are the specific numbers. c, The number of endogenous mitochondrial genome sequences found in each assembly.
Extended Data Fig. 2
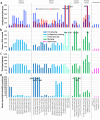
Extended Data Fig. 2. Assembly size and false duplication metrics.
a, Percent assembly sizes of expected maternal with Chr X (3,054,832,041 bp) or paternal with Y (2,995,432,041 bp) for trio-based assemblies, or simply relative to maternal size for all other assemblies. b, Total summed length of all contigs. c, Total summed length of scaffolds, with proportion contributed by Ns (red) in gaps. d, estimated percent of assembly size that is due to false duplications based on k-mer values for each haplotype. Color coding and gray shaded regions are as described in Fig. 1.
Extended Data Fig. 3
Extended Data Fig. 3. Contig, scaffold, and gap metrics.
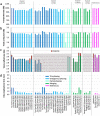
a, Total number of contigs in each assembly. b, Total number of scaffolds in each assembly. c, Total number of gaps in each assembly. Values above the maximum on the y-axis are written in the graph so as to not visually scale down the majority of the results. Color coding and gray shaded regions are as described in Fig. 1.
Extended Data Fig. 4
Extended Data Fig. 4. Hi-C contact maps.
a, Example Hi-C contact maps for bakeoff maternal (mat) and paternal (pat) haplotype assemblies. The Trio VGP scaffolded assembly has several dozen large joins and many small ones to make from the off-diagonal signals. The Trio hifiasm contig only assembly as expected has many more needed. b, Reference HPRC HG002 assemblies for each haplotype before and after manual curation, showing less off diagonal signals and no major scaffolds/contigs not placed in chromosomes after curation.
Extended Data Fig. 5
Extended Data Fig. 5. Strand-seq validations.
a, Total number and total Mb of chimeric and misorientation errors for each assembly according to Strand-seq validations. b, Large (> 50 kb) Strand-seq supported and unsupported inversions (x location; n = 59) between HG002 haplotypes. HET, regions with roughly equal mixture of plus (Crick) and minus (Watson) Strand-seq reads supporting the heterozygous inversions (yellow, n = 30). HOM, regions with Strand-seq reads mapped to the opposite orientation in disagreement with heterozygous inversions and thus a possible assembly error (blue, n = 11). c, Barplot of total size and total number of regions genotyped as HET and HOM validated inversions. d-f, Example heterozygous assembly inversions that matched (d) or did not match (e,f) the Strand-seq read direction in the final HG002 assembly. First track: Known morbid CNVs (red, deletions; blue, duplications). Second track: Segmental duplications (black marks - DupMasker) in the paternal assembly. Third and fourth tracks: Coverage of Strand-seq reads aligned to the HG002 paternal and maternal assemblies (binsize: 50 kb, stepsize: 1 kb) with Crick (teal, above) and Watson (below, orange) read counts. Regions with roughly equal coverage of Watson and Crick counts represent validated heterozygous inversions, as only one homolog is inverted with respect to the de novo assembly (d); Regions with only Watson coverage orientation represent an assembly error, because assembly directionality does not match Strand-seq read directionality (e,f). Vertical dotted lines highlight the predicted breakpoints of assembly errors as well as predicted heterozygous inversion.
Extended Data Fig. 6
Extended Data Fig. 6. Variant benchmarking.
a, True positive percent of known SNVs found between HG002 haplotypes in each assembly. b, True positive percent of known small indels found between HG002 haplotypes in each assembly. For the diploid assemblies, comparisons were made between the two haplotypes (maternal vs paternal for the trio assemblies; haplotype 1 vs haplotype 2 for the non-trio assemblies). For the haploid assemblies, we scored as TP if at least one of the variants were found.
Extended Data Fig. 7
Extended Data Fig. 7. Annotation benchmarking.
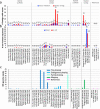
a, Side-by-side comparisons of gene transcripts that did not align to each assembly (blue) versus those that were split between two or more scaffolds/contigs (red). b, Number of genes that had less than 95% the length covered in the assembly. c, Genes in the assemblies with overlapping transcripts due to possible collapse in the assemblies. d, Genes requiring frameshift corrections to make a complete protein. Values written in the graphs are for those off the chart, in order to not mask the lower values of most other assemblies.
Extended Data Fig. 8
Extended Data Fig. 8. Haplotype phasing metrics.
a, Haplotype switch errors within scaffolds and/or contigs of each assembly (lower % is more accurate). Values written in the graphs for the haploid assemblies (greens) are off the chart, in order to not mask the lower switch error values of most other assemblies. b, Total Gb of each assembly that has been haplotype phased (~3.0 is the theoretical maximum of the maternal haplotype; 2.9 for the paternal). c, Haplotype phasing completeness according to parental k-mer statistics for each assembly. A complete phased assembly will have both maternal (blue) and paternal (red) each at 100% without mixture from the other. The trio approaches had nearly full phase separation, whereas the non-trio approaches nearly had half and half separation because there was not an attempt to phase across contigs or scaffolds/chromosomes belonging to the same maternal or paternal haplotypes. Combined values over 100% indicate a mixture of haplotype presumably due to false duplications; although values under 100% could still have false duplications.
Extended Data Fig. 9
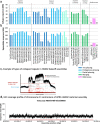
Extended Data Fig. 9. Collapsed sequence metrics.
a, Estimated amount of bp that are collapsed in each assembly (smaller is better). Collapses are most often due to repetitive sequences. b, Estimated amount of bp that are potentially expandable. The smaller, the more accurate the assembly. We estimate that most of these collapses are in centromeric regions and satellites, with a smaller proportion coming from segmental duplications. Abbreviations and color coding explanations are the same as in Fig. 1 legend. c, Example collapse region of one of the HG002 assemblies, where read coverage pile up in the collapsed region is two or more times higher than the mean coverage of the genome. d, Example of HiFi read coverage across a centromere, of HG002 maternal Chr 11, showing no evidence of collapsed repeats or coverage dropouts.
Extended Data Fig. 10
Extended Data Fig. 10. Pangenome alignment and generation of high-quality HPRC-HG002 v1.0 diploid assemblies.
a, Output of graph-based alignment of all chromosomes concatenated from all 45 HG002 assemblies (both haplotypes of diploid assemblies). Red vs Black, different orientations. Dendogram at bottom is a clustering of the alignments. b, HPRC v1.0 pipeline developed to produce the reference quality HPRC-HG002 v1.0 maternal and paternal assemblies. All steps shown are highlighted for the maternal data. The key steps of the pipeline are available in the Galaxy Server (https://assembly.usegalaxy.eu/) and best practices from this study at https://github.com/human-pangenomics/hpp_production_workflows/wiki/Assembly-Best-Practices.
Extended Data Fig. 11
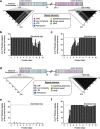
Extended Data Fig. 11. Example presence of telomeres.
a, Telomere repeats within 10 kb of each arm of HG002 Chr 1, paternal haplotype. The darker the density, the higher the repeat copy number. b-c, Density of telomere repeats for each arm, in 200 bp bins. 33 x 6-bp repeats is the theoretical maximum per 200 bp. d, Telomere repeats within 10 kb only found for the q-arm of HG002 Chr 12, maternal haplotype. e-f, Canonical pattern of the telomere repeats only found in the q-arm of the HG002 Chr 12, maternal assembly. Color coding, the different types of repeats found within 1 Mb of each arm. The similar patterns between Chr 1 and 12 indicate that only the p-arm telomere is missing from Chr 12.

Similar articles

  • De novo assembly and phasing of a Korean human genome.
    Seo JS, Rhie A, Kim J, Lee S, Sohn MH, Kim CU, Hastie A, Cao H, Yun JY, Kim J, Kuk J, Park GH, Kim J, Ryu H, Kim J, Roh M, Baek J, Hunkapiller MW, Korlach J, Shin JY, Kim C. Seo JS, et al. Nature. 2016 Oct 13;538(7624):243-247. doi: 10.1038/nature20098. Epub 2016 Oct 5. Nature. 2016. PMID: 27706134
  • A draft human pangenome reference.
    Liao WW, Asri M, Ebler J, Doerr D, Haukness M, Hickey G, Lu S, Lucas JK, Monlong J, Abel HJ, Buonaiuto S, Chang XH, Cheng H, Chu J, Colonna V, Eizenga JM, Feng X, Fischer C, Fulton RS, Garg S, Groza C, Guarracino A, Harvey WT, Heumos S, Howe K, Jain M, Lu TY, Markello C, Martin FJ, Mitchell MW, Munson KM, Mwaniki MN, Novak AM, Olsen HE, Pesout T, Porubsky D, Prins P, Sibbesen JA, Sirén J, Tomlinson C, Villani F, Vollger MR, Antonacci-Fulton LL, Baid G, Baker CA, Belyaeva A, Billis K, Carroll A, Chang PC, Cody S, Cook DE, Cook-Deegan RM, Cornejo OE, Diekhans M, Ebert P, Fairley S, Fedrigo O, Felsenfeld AL, Formenti G, Frankish A, Gao Y, Garrison NA, Giron CG, Green RE, Haggerty L, Hoekzema K, Hourlier T, Ji HP, Kenny EE, Koenig BA, Kolesnikov A, Korbel JO, Kordosky J, Koren S, Lee H, Lewis AP, Magalhães H, Marco-Sola S, Marijon P, McCartney A, McDaniel J, Mountcastle J, Nattestad M, Nurk S, Olson ND, Popejoy AB, Puiu D, Rautiainen M, Regier AA, Rhie A, Sacco S, Sanders AD, Schneider VA, Schultz BI, Shafin K, Smith MW, Sofia HJ, Abou Tayoun AN, Thibaud-Nissen F, Tricomi FF, Wagner J, Walenz B, Wood JMD, Zimin AV, Bourque G, Chaisson MJP, Flicek P, Phillippy AM, Zook JM, Eichler EE, … See abstract for full author list ➔ Liao WW, et al. Nature. 2023 May;617(7960):312-324. doi: 10.1038/s41586-023-05896-x. Epub 2023 May 10. Nature. 2023. PMID: 37165242 Free PMC article.
  • Dense and accurate whole-chromosome haplotyping of individual genomes.
    Porubsky D, Garg S, Sanders AD, Korbel JO, Guryev V, Lansdorp PM, Marschall T. Porubsky D, et al. Nat Commun. 2017 Nov 3;8(1):1293. doi: 10.1038/s41467-017-01389-4. Nat Commun. 2017. PMID: 29101320 Free PMC article.
  • Haplotyping-Assisted Diploid Assembly and Variant Detection with Linked Reads.
    Hu Y, Yang C, Zhang L, Zhou X. Hu Y, et al. Methods Mol Biol. 2023;2590:161-182. doi: 10.1007/978-1-0716-2819-5_11. Methods Mol Biol. 2023. PMID: 36335499 Review.
  • The Human Pangenome Project: a global resource to map genomic diversity.
    Wang T, Antonacci-Fulton L, Howe K, Lawson HA, Lucas JK, Phillippy AM, Popejoy AB, Asri M, Carson C, Chaisson MJP, Chang X, Cook-Deegan R, Felsenfeld AL, Fulton RS, Garrison EP, Garrison NA, Graves-Lindsay TA, Ji H, Kenny EE, Koenig BA, Li D, Marschall T, McMichael JF, Novak AM, Purushotham D, Schneider VA, Schultz BI, Smith MW, Sofia HJ, Weissman T, Flicek P, Li H, Miga KH, Paten B, Jarvis ED, Hall IM, Eichler EE, Haussler D; Human Pangenome Reference Consortium. Wang T, et al. Nature. 2022 Apr;604(7906):437-446. doi: 10.1038/s41586-022-04601-8. Epub 2022 Apr 20. Nature. 2022. PMID: 35444317 Free PMC article. Review.

Cited by

References

    1. Lander ES, et al. Initial sequencing and analysis of the human genome. Nature. 2001;409:860–921. - PubMed
    1. Schneider VA, et al. Evaluation of GRCh38 and de novo haploid genome assemblies demonstrates the enduring quality of the reference assembly. Genome Res. 2017;27:849–864. - PMC - PubMed
    1. Sherman RM, Salzberg SL. Pan-genomics in the human genome era. Nat. Rev. Genet. 2020;21:243–254. - PMC - PubMed
    1. Logsdon GA, Vollger MR, Eichler EE. Long-read human genome sequencing and its applications. Nat. Rev. Genet. 2020;21:597–614. - PMC - PubMed
    1. Nurk S, et al. The complete sequence of a human genome. Science. 2022;376:44–53. - PMC - PubMed

Publication types

MeSH terms