. 2022 Oct 18;8(1):134.
doi: 10.1038/s41531-022-00400-0.

Druggable transcriptomic pathways revealed in Parkinson's patient-derived midbrain neurons

Affiliations

Druggable transcriptomic pathways revealed in Parkinson's patient-derived midbrain neurons

Mark van den Hurk et al. NPJ Parkinsons Dis. .

Abstract

Complex genetic predispositions accelerate the chronic degeneration of midbrain substantia nigra neurons in Parkinson's disease (PD). Deciphering the human molecular makeup of PD pathophysiology can guide the discovery of therapeutics to slow the disease progression. However, insights from human postmortem brain studies only portray the latter stages of PD, and there is a lack of data surrounding molecular events preceding the neuronal loss in patients. We address this gap by identifying the gene dysregulation of live midbrain neurons reprogrammed in vitro from the skin cells of 42 individuals, including sporadic and familial PD patients and matched healthy controls. To minimize bias resulting from neuronal reprogramming and RNA-seq methods, we developed an analysis pipeline integrating PD transcriptomes from different RNA-seq datasets (unsorted and sorted bulk vs. single-cell and Patch-seq) and reprogramming strategies (induced pluripotency vs. direct conversion). This PD cohort's transcriptome is enriched for human genes associated with known clinical phenotypes of PD, regulation of locomotion, bradykinesia and rigidity. Dysregulated gene expression emerges strongest in pathways underlying synaptic transmission, metabolism, intracellular trafficking, neural morphogenesis and cellular stress/immune responses. We confirmed a synaptic impairment with patch-clamping and identified pesticides and endoplasmic reticulum stressors as the most significant gene-chemical interactions in PD. Subsequently, we associated the PD transcriptomic profile with candidate pharmaceuticals in a large database and a registry of current clinical trials. This study highlights human transcriptomic pathways that can be targeted therapeutically before the irreversible neuronal loss. Furthermore, it demonstrates the preclinical relevance of unbiased large transcriptomic assays of reprogrammed patient neurons.


Conflict of interest statement

The authors declare no competing interests.

Figures
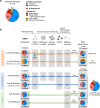
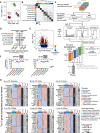
Fig. 1
Fig. 1. Patient and sample distributions of six transcriptomic datasets of Parkinson’s disease reprogrammed neurons.
A The transcriptome data analyzed in the present study were collected across six different datasets and originate from the reprogrammed neurons of n = 25 healthy individuals, n = 7 patients with known mutations in PD genes, and n = 10 patients with a sporadic form of the disease (n = 42 unique subjects total). B Overview of tissue culture trajectories used in six reprogramming studies to generate in vitro midbrain-like neurons from PD patient- and healthy subject-derived fibroblasts (see Methods for details). Pie charts on the left summarize the number of subjects from which neurons were derived, color-coded by disease phenotype and mutation type as shown in (A). Neuron cultures were generated via induced pluripotent stem cell (iPSC) technology (n = 4 studies) or by direct conversion of fibroblasts into induced neurons (iNs, n = 2 studies), and neuronal transcriptome data was obtained by single-cell or bulk RNA-seq (n = 2 and 4 studies, respectively). The trajectory color reflects the combinatory choice of the reprogramming and sequenced method used (orange: single-cell iPSC neuron datasets; blue: bulk iPSC neuron datasets; green: bulk iN datasets). Single-cell RNA-seq was performed on (i) functionally mature (AP Types 4 + 5) single neurons collected after patch-clamp recording (PatchSeq, n = 44) or on (ii) wild-type and isogenic SNCA-A53T neurons harvested using 10X Chromium technology. The two iN datasets enriched for successfully reprogrammed (i.e., PSA-NCAM-positive) neurons using fluorescence-activated cell sorting (FACS). The bulk-iPS-Dopa and bulk-iN-Dopa studies used an optimized differentiation protocol to generate a high proportion of midbrain dopaminergic neurons. Pie charts on the right indicate the number of cells or samples sequenced per disease state and/or mutation type. A total of 5,359 single neurons and 80 neuronal bulk samples were analyzed.
Fig. 2
Fig. 2. Identification, scoring and ranking of genes dysregulated in Parkinson’s disease reprogrammed neurons.
A Principal component analysis (PCA) of the transcriptome data from PD patient- and control- reprogrammed neurons collected across six datasets, post-mortem adult human substantia nigra samples (GTEx), and highly pure populations of human floor plate-derived midbrain dopaminergic neurons (iCell® DopaNeurons). In vitro-engineered neuronal tissue clusters separately from post-mortem substantia nigra tissue (GTEx) and groups by method of derivation (iPSC reprogramming or direct iN conversion) irrespective of the laboratory of origin. Each data point represents a bulk or artificial bulk (for single-cell RNA-seq datasets) tissue transcriptome. Artificial bulk samples were generated by summing up the gene counts from all cells of the same subject. Color indicates dataset of origin (annotation shown in (B)). B Heatmap clustering of the average transcriptomes of the six reprogrammed neuron datasets, GTEx substantia nigra and striatum tissues, and iCell® DopaNeurons using all expressed genes (≥1 transcript per million [TPM] across all samples). Hierarchical clustering is based on average linkage and Euclidean distance-based similarity. The darker shade denotes higher similarity. C Pipeline for computation of a per-gene dysregulation score (D) based on individual-dataset differential expression (DE) analysis results. DE analysis was performed on each dataset independently on both read counts and TPM values, and results were combined using logitp method (for a combination of P-values) and arithmetic mean averaging (for a combination of log2 fold changes). Combined P-value and log2 fold change measures were mapped to a continuous (0.01-1) scale using desirability functions, and integrated by weighted geometric averaging to obtain an overall dysregulation score (D) for each gene. Information about whether the gene was expressed in the adult human midbrain was used as a soft filter at 1% of the total weight to prioritize the ranking of relevant genes. Dysregulation scores are integrated across multiple datasets, weighting for cross-dataset similarity in log2 fold change directionality, to obtain an overall dysregulation score per gene (Doverall; refer to Methods for details). D Number of genes (P < 0.05 and |fold change | ≥ 1.25) up- and downregulated in each dataset of PD versus healthy control reprogrammed neurons. E Volcano plot of differentially expressed genes between PD and control reprogrammed neurons (shown for dataset bulk-iN-Mixed). Genes with greater statistical significance and/or greater fold change in expression have a larger dysregulation score (D; color-coded in plot). F Dataset expression levels of housekeeping genes GAPDH and ACTB are very similar between patients and controls and are associated with a low overall (multiple-dataset) dysregulation score. G Relative expression levels of the top 15 differentially expressed genes in PD versus control neurons in each of the six analyzed RNA-seq datasets. Each heatmap cell represents a single cell (single-cell datasets) or bulk tissue sample (bulk datasets). Disease phenotype and subject ID are annotated horizontally, and gene function is annotated vertically according to the legend. A subset of individuals (N = 17) was selected to generate both IPSC and iN models, and three neuronal lines were profiled using both single-cell and bulk RNA-sequencing (see Supplementary Table 1 for subject details). For each gene, the dataset-specific dysregulation score and rank, as well as the overall dysregulation score calculated across all six datasets, are shown on the right with dark intensity indicating the strength of the score.
Fig. 3
Fig. 3. Integrative analysis of multiple transcriptomics datasets reveal Parkinson’s disease-related gene signatures and biological processes in patient-reprogrammed neurons.
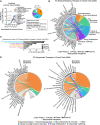
A Heatmap of mean log2 fold changes in expression of the top 20 genes with the highest dysregulation across all six datasets of PD versus control reprogrammed neurons. Red and blue indicate, respectively, up- and downregulation in PD cells relative to control. Gene function and overall dysregulation score (Doverall) are annotated vertically according to the legend. Dsc-iPS, Dbulk-iPS and Dbulk-iN scores indicate the strength of dysregulation for, respectively, the two single-cell iPSC neuron datasets (orange), the two bulk iPSC neuron datasets (blue) and the two bulk iN datasets (green) (see Methods for details). *, nominal Pcombined < 0.05. B, C, D ToppFun functional enrichment analysis of the 200 most highly dysregulated genes across all datasets highlights fundamental biological processes (B), cellular components (C) and chemicals (D) implicated or suspected to be involved in PD. Chord plot in (B) indicates genes annotated to dysregulated GO biological processes, ordered by decreasing overall dysregulation score. Length of bars in (C, D) represent Benjamini-Hochberg-corrected significance values and numbers indicate number of genes annotated to GO term; grey color indicates significance threshold. Extended data in Supplementary Tables 4 and 5. E Gene Set Enrichment Analysis (GSEA) of multiple-dataset PD dysregulated genes for genes associated with the terms “Parkinsonism”, “Dementia” and “Schizophrenia” from the Human Phenotype Ontology (HPO) database. “Parkinsonism”- and “Dementia”-related genes were significantly overrepresented at the top of the list of expressed genes (n = 24,693) rank-ordered by decreasing Doverall score. F GSEA shows a significant enrichment of PD-symptom-related HPO terms “Bradykinesia”, “Rigidity”, “Akinesia”, “Dyskinesia” and “Postural instability” among the multiple-dataset PD dysregulated genes. Vertical bars in (E, F) represent the “gene hits”, i.e., the location of genes from each indicated HPO term within the Doverall rank-ordered list. *P < 0.05; **P < 0.01; ***P < 0.001; ****P < 0.0001; ns, not significant (P > 0.05); all P-values are FWER-corrected to exclude any possibility of false-positive enrichment. NES Normalized Enrichment Score. Detailed enrichment results are provided in Supplementary Table 6.
Fig. 4
Fig. 4. Gene Set Enrichment Analysis identifies transcriptomic pathways perturbed in Parkinson’s patient-derived neurons.
Enrichment map representation of the main biological processes dysregulated in PD versus control reprogrammed neurons. Pathway gene sets (n = 5654 passing size filters) corresponding to gene ontology (GO) biological process terms were tested for enrichment by Gene Set Enrichment Analysis (GSEA) following a recent protocol. GSEA revealed significant (FDR-q < 0.01) overrepresentation of 579 pathway gene sets at the top of the list of expressed genes (n = 24,693) rank-ordered by decreasing overall dysregulation score (Doverall, genes with highest dysregulation across all studies at top). Functionally related pathway sets were assigned a label and grouped together based on similarity, resulting in 408 dysregulated pathways related to six main biological themes, including (i) neurotransmission and synaptic function, (ii) cytoskeleton and neuromorphogenesis, (iii) cellular and oxidative stress responses, (iv) energy and metabolism, (v) glia, inflammation and immunity, and (vi) intracellular trafficking. Node size is proportional to the number of genes in the pathway gene set, and node color intensity indicates the statistical significance of GO term enrichment. Edge thickness represents the degree of gene overlap between connected biological pathways. Detailed pathway enrichment results are provided in Supplementary Table 7.
Fig. 5
Fig. 5. Synaptic impairments in PD patient reprogrammed neurons.
A GSEA shows significant enrichment (FDR-q < 0.0001) of the Human Phenotype Ontology gene set for “abnormality of central nervous system electrophysiology” (HP:0030178) among the genes dysregulated in PD patient-derived neurons. B Example image of a typical neuronal culture used for patch-clamping electrophysiology in DIC (top image) or filled with Rhodamine (bottom image). Cells with characteristic neuronal morphology and brightest Synapsin:GFP expression were selected for patch-clamp recordings after a minimum of three weeks (average 43 days) of maturation in BrainPhys™ neuronal medium. Cells were patched from a total of 76 coverslips. C, D All patch-clamped neurons included in the analysis (n = 80 healthy subject-derived, n = 89 PD patient-derived) were classified as “Type 5” cells, indicating equivalent functional maturity (see Methods for details). C Typical evoked action potential (AP) traces from PD patient and control-derived neurons following a 500-ms depolarizing current step. D The maximum firing frequency of evoked APs with amplitudes above -10 mV was similar between PD and control neurons. E Voltage-dependent sodium current characteristics were similar between PD and control neurons. FM Synaptic properties of patch-clamped midbrain neurons from PD and healthy controls. F Typical recordings of excitatory postsynaptic synaptic currents mediated by AMPA receptors (left) and superimposed detected events and average trace (right). Data are presented as mean ± SEM. P values determined via nonparametric Mann-Whitney test (two-tailed, unpaired).
Fig. 6
Fig. 6. Prediction of therapeutics for Parkinson’s disease based on dysregulated transcriptomic pathways.
A GSEA against DrugBank’s database of drug-target gene associations (n = 5,724 gene sets) identifies 18 therapeutic drugs, each associated with a minimum of 15 target genes, that are significantly (FDR-q < 0.05) overrepresented among PD-dysregulated genes. The top 15 enriched drug candidates with the highest significance and enrichment score are annotated on the right, with FDA-approved drugs indicated by asterisks. The color code indicates each drug’s main mechanism of action in relation to the major biological themes dysregulated in PD reprogrammed neurons (Fig. 5). B, D. Chord plots of disease-modifying (B) and symptomatic (D) PD clinical trial therapies in 2020 (identified by, left semicircle) and their involvement in dysregulated transcriptomic pathways in PD (right semicircle). Therapies were filtered for redundancy and are grouped by clinical trial phase (see legend). Asterisks indicate repurposed therapeutics. Symptomatic therapies in (D) are categorized into those targeting movement symptoms (left) and those targeting non-motor symptoms (right). C, E. The number of disease-modifying (C) and symptomatic (E) clinical trials targeting the various dysregulated molecular pathways implicated in PD, subcategorized by clinical trial phase.

Similar articles

Cited by

References

    1. Bloem BR, Okun MS, Klein C. Parkinson’s disease. Lancet. 2021;397:2284–2303. doi: 10.1016/S0140-6736(21)00218-X. - DOI - PubMed
    1. McFarthing K, et al. Parkinson’s Disease Drug Therapies in the Clinical Trial Pipeline: 2020. J. Parkinsons Dis. 2020;10:757–774. doi: 10.3233/JPD-202128. - DOI - PMC - PubMed
    1. Elkouzi A, Vedam-Mai V, Eisinger RS, Okun MS. Emerging therapies in Parkinson disease — repurposed drugs and new approaches. Nat. Rev. Neurol. 2019;386:1. - PMC - PubMed
    1. Wood-Kaczmar A, Gandhi S, Wood NW. Understanding the molecular causes of Parkinson’s disease. Trends Mol. Med. 2006;12:521–528. doi: 10.1016/j.molmed.2006.09.007. - DOI - PubMed
    1. Mellick GD, Silburn PA, Sutherland GT, Siebert GA. Exploiting the potential of molecular profiling in Parkinson’s disease: current practice and future probabilities. Expert Rev. Mol. Diagnostics. 2014;10:1035–1050. doi: 10.1586/erm.10.86. - DOI - PubMed