. 2023 Jan 2;222(1):e202201088.
doi: 10.1083/jcb.202201088. Epub 2022 Oct 17.

Liquid-liquid phase separation mediates the formation of herpesvirus assembly compartments

Affiliations

Liquid-liquid phase separation mediates the formation of herpesvirus assembly compartments

Sheng Zhou et al. J Cell Biol. .

Abstract

Virus assembly, which takes place during the late stage of viral replication, is essential for virus propagation. However, the underlying mechanisms remain poorly understood, especially for viruses with complicated structures. Here, we use correlative light and electron microscopy to examine the formation of cytoplasmic virion assembly compartments (cVACs) during infection by a γ-herpesvirus. These cVACs are membraneless organelles with liquid-like properties. Formation of cVACs during virus infection is mediated by ORF52, an abundant tegument protein. ORF52 undergoes liquid-liquid phase separation (LLPS), which is promoted by both DNA and RNA. Disrupting ORF52 phase separation blocks cVACs formation and virion production. These results demonstrate that phase separation of ORF52 is critical for cVACs formation. Our work defines herpesvirus cVACs as membraneless compartments that are generated through a process of LLPS mediated by a tegument protein and adds to the cellular processes that are facilitated by phase separation.


Figures

Figure S1.
Figure S1.
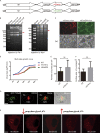
Construction and analyses of recombinant MHV-68 viruses. (A) A schematic diagram of mCherry-ORF52 BAC and mEosEM-ORF52 BAC constructs. (B) Left panel: WT BAC DNA and mCherry-ORF52 BAC DNA were isolated from E. coli strain SHG68 (GS1783). The DNAs were digested with PteI. The arrow indicates the position of a 7.8-kb PteI fragment resulting from mCherry insertion. Right panel: WT BAC DNA and mEosEM-ORF52 BAC DNA were isolated from E. coli strain SHG68 (GS1783). The DNAs were digested with KpnI. The arrow indicates the position of a 7.7-kb KpnI fragment which disappeared as a result of mEosEM insertion. (C) 293T cells were individually transfected with mCherry-ORF52 BAC or mEosEM-ORF52 BAC and images were captured by a fluorescence microscope. Bright-field images of the same area are shown on the bottom. Bar: 200 μm. (D) Multi-step growth curves of the recombinant viruses. BHK cells were infected with the indicated viruses at an MOI = 0.05 and cultured for 4 d. Viral titers were examined at the indicated time points. Values shown are means ± SD (n = 3). (E and F) Quantification of cytoplasmic ORF52 puncta in COS-7 cells infected by WT virus or mCherry-ORF52 virus. COS-7 cells were infected with WT virus or mCherry-ORF52 virus at a MOI of 3 and fixed at 18 hpi. Number of ORF52 puncta per cell (E) and mean surface areas of puncta (F) were measured using the microscopy image analysis software, Imaris. Error bar represents SD. Statistical analyses were performed using a two-tailed non-parametric t test. Data were collected from at least three independent experiments. (E) WT, n = 6; mCherry, n = 7. (F) WT, n = 6; mCherry, n = 5. (G) Analysis of co-localization of ORF52 with TGN. A plasmid expressing GFP-TGN46 was transfected into COS-7 cells. At 12 h post transfection, COS-7 cells were infected with mCherry-ORF52 virus. Cells were fixed at 24 hpi and observed with a confocal microscope (FV1200). Shown are the merged images of GFP-TGN signals (green) and mCherry-ORF52 signals (red) without the bright-field image (Merge 1) or with the bright-field image (Merge 2). Nu, nucleus. Bar: 5 μm. (H) Fluorescent images of COS-7 cells infected with mCherry-ORF52 virus at an MOI = 3 and treated with 6% propylene glycol (PG) at 24 hpi. Bar: 5 μm. Source data are available for this figure: SourceData FS1.
Figure 1.
Figure 1.
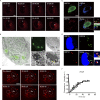
cVACs are formed during γ-herpesvirus infection and have liquid properties. (A) Time-lapse imaging of cVAC formation. COS-7 cells were infected with mCherry-ORF52 recombinant virus at a MOI of 3 and images were collected from 12 hpi (00:00:00). cVACs formed gradually in the cytoplasm over time. Bar: 5 μm. (B) CLEM images of a 100-nm ultrathin section of a cell infected by mEosEM-ORF52 recombinant virus. (a) Direct correlation between green fluorescence (representing ORF52) and TEM in a 293T cell. (b and c) Green fluorescence of cVACs in cytoplasm and TEM image of the whole 293T cell, respectively, after infection by recombinant virus. (i and ii) Enlarged images of the boxed areas in panel a, showing tegumentation and secondary envelopment of viral capsids in ORF52 puncta. Scale bars: 3 µm (main image); 1 µm (zoomed-in images). Black arrowhead: cVAC; white arrowheads: capsids; yellow arrowheads: gold nanoparticles used as fiducial markers for registration of light and electron microscopy images. (C) Co-localization of ORF33 (homologue of UL16 in HSV-1 and UL94 in HCMV) and ORF45 with cVACs. COS-7 cells were infected with mCherry-ORF52 virus (MOI = 3), and indirect immunofluorescence assay was performed at 24 hpi. ORF33 was detected using a mouse anti-ORF33 monoclonal antibody and ORF45 was detected using a rabbit anti-ORF45 polyclonal antibody. Secondary antibodies were conjugated with Alexa Fluor 488 (ORF33, green channel) or Alexa Fluor 647 (ORF45, blue channel). Bar: 5 μm. (D) Co-localization of ORF33 and ORF38 (homologue of UL11 in HSV-1 and UL99 in HCMV) with cVACs. The experiment was conducted as in C, except that ORF38 was detected using a rabbit anti-ORF38 polyclonal antibody. Bar: 5 μm. (E) FRAP of a cVAC in COS-7 cells at 37°C (box: bleach site; Nu, nucleus). These images are representative of at least three cells in which the cVAC puncta were photobleached. Bar: 5 μm. (F) Quantification of FRAP of cVAC puncta. Fluorescence intensities of cVACs were normalized to background and plotted over a 60-s time course. Shown are means ± SD. n = 3 cVAC puncta.
Figure S2.
Figure S2.
Analyses of ORF52 phase separation. (A) Plasmids expressing different tegument proteins were individually transfected into COS-7 cells. At 24 h post transfection, the cells were fixed with 4% paraformaldehyde and then permeabilized with 0.2% Triton X-100. Indirect immunofluorescence analysis was carried out using an antibody against HA-tag or Flag-tag. Bar: 5 μm. (B) Purity of bacterially expressed ORF52, analyzed by Coomassie blue staining. (C) Phase separation diagram of ORF52 at the indicated concentrations. ORF52 with the indicated concentrations were incubated in phase separation assay buffer with different concentrations of NaCl and visualized by confocal microscopy. P.S, phase separation. (D) Expression levels of ORF52 in 293T cells after MHV-68 infection (MOI = 3) at different hours post infection, as examined by Western blotting. con1-3: Bacterially expressed and purified ORF52 proteins were loaded at the indicated amount to draw standard curve. (E) Phase separation assay of ORF52 with v-tRNA was performed in physiological buffer. 10 μM ORF52 protein (3% Alexa 488-labeled) was mixed with 100 ng/μl v-tRNA in 96-well plates coated with 20 mg/ml BSA. Mixtures were incubated and images were captured by confocal microscopy. Bar: 10 μm. (F) Phase separation assay of ORF52 with total RNA extracted from infected or uninfected cells was performed in physiological buffer. 10 μM ORF52 protein was mixed with 100 ng/μl total RNA in 96-well plates coated with 20 mg/ml BSA. Mixtures were incubated and images were captured by confocal microscopy. Bar: 10 μm. Source data are available for this figure: SourceData FS2.
Figure 2.
Figure 2.
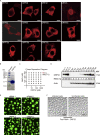
ORF52 possesses LLPS properties and is required for cVACs formation. (A) ORF52 forms puncta in COS-7 cells after transfection. Plasmids expressing RFP-ORF52 or mCherry-ORF52 were individually transfected into COS-7 cells. Cells were observed with a fluorescence microscope. Bar: 5 μm. (B) mCherry-labeled ORF52 forms spherical bodies in cells. The XY, XZ, and YZ planes of a representative ORF52 body are shown. Bar: 2 μm. (C) A plot showing the sphericity of ORF52 bodies (n = 94). Error bars represent SD. (D) Fusion of ORF52 puncta. Plasmids expressing mCherry-ORF52 were transfected into COS-7 cells. Cells were observed with a time-lapse microscope at 24 h post transfection. Bar: 2 μm. (E) FRAP of mCherry-ORF52 in COS-7 cells at 37°C. Bar: 2 μm. (F) Formation of cVACs relies on ORF52. 293T cells were transfected with ORF52-null BAC and detected by indirect immunofluorescence at 48 h post transfection. ORF33 was detected using a mouse anti-ORF33 monoclonal antibody, followed by an Alexa Fluor 488-conjugated secondary antibody (green channel). ORF45 was detected using a rabbit anti-ORF45 polyclonal antibody, followed by an Alexa Fluor 647-conjugated secondary antibody (red channel). Nuclei were stained with DAPI (blue channel). Bar: 5 μm. (G) TEM of a 293T cell transfected with ORF52-null BAC. The right panel shows an enlargement of the boxed area from the left panel. Scale bars: 3 µm (main image); 0.5 µm (zoomed-in image). White arrowheads: capsids.
Figure 3.
Figure 3.
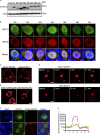
Nucleic acids drive phase separation of ORF52. (A) In vitro phase separation assay of ORF52 with DNA. Phase separation of ORF52 with 45-bp ds-DNA was performed in 20 mM Tris-HCl, pH 7.5, 150 mM NaCl. 10 μM ORF52 protein was mixed with 5 μM 45-bp ds-DNA (2% Cy3-labeled) in 96-well plates coated with 20 mg/ml BSA. Mixtures were incubated and images were captured by confocal microscopy. Bar: 20 μm. (B) ORF52 phase separation in vitro in the presence of total RNA isolated from COS-7 cells. Phase separation of ORF52 with total RNA was performed in physiological buffer. 5 μM ORF52 protein (3% Alexa 488-labeled) was mixed with 100 ng/μl total RNA in 96-well plates coated with 20 mg/ml BSA. Mixtures were incubated and images were captured by confocal microscopy. Bar: 10 μm. (C) Fusion of ORF52-DNA droplets formed during the in vitro phase separation process. Bar: 5 μm. (D) FRAP of ORF52-DNA liquid droplets. Bleaching was performed during the in vitro phase separation process. (E) Phase separation diagram of ORF52 with ds-DNA. Bar: 5 μm. (F) Fusion of ORF52-RNA droplets formed during the in vitro phase separation process. Bar: 5 μm. (G) FRAP of ORF52-RNA liquid droplets. Bleaching was performed during the in vitro phase separation process. Bar: 5 μm. (H) Phase separation diagram of ORF52 with total cellular RNAs. (I) cVACs contain little DNA. After infection with mEosEM-ORF52 virus (MOI = 3), COS-7 cells were fixed and stained with DAPI. Bar: 5 μm. (J) RNA is concentrated in cVACs. EU was added to cultured COS-7 cells to label nascent RNA 24 h before the cells were infected with mCherry-ORF52 virus. EU-labeled RNA was detected by click chemistry reaction. Bar: 5 μm.
Figure 4.
Figure 4.
The LLPS properties of ORF52 are critical for cVACs formation and virion production. (A) Schematic presentation of full-length and mutant ORF52 proteins. (B and C) ORF52 mutants have different phase separation properties. Plasmids expressing mCherry-ORF52 or mCherry-tagged mutants were individually transfected into COS-7 cells. Cells were observed with a fluorescent microscope at 24 h post transfection (B). Bar: 5 μm. In each experiment, 30 cells expressing mCherry-ORF52 or mutants were randomly chosen. Cells with ORF52 puncta were counted, and the percentage of cells with ORF52 puncta among all cells expressing fluorescent protein was calculated (C). Values shown are means ± SD (n = 3). (D and E) Phase separation of ORF52 is critical for complete viral replication and mature virion formation. WT BAC or BAC containing the indicated ORF52 mutation was transfected individually into 293T cells. After 96 h, viral genome copies in the supernatant were determined by real-time PCR (D) and viral titers were examined by plaque formation assay (E). Values shown are means ± SD (n = 3). (F) ORF52 phase separation is required for cVACs formation. 293T cells were individually transfected with WT BAC or BAC harboring the indicated ORF52 mutation. cVAC structure was analyzed by TEM. Bar: 0.2 μm. Red boxes: cVACs; white arrowheads: capsids or immature viral particles; red arrowheads: mature viral particles.
Figure S3.
Figure S3.
Analyses of ORF52 mutants and the LLPS properties of ORF52 from other γ-herpesviruses. (A) Empty vector or plasmids expressing mCherry-ORF52 or plasmids expressing mCherry-tagged mutants were individually transfected into 293T cells. Cells were collected for Western blot at 48 h post transfection. (B) 293T cells were transfected with ORF52 mutant BAC and detected by indirect immunofluorescence at 48 h post transfection. ORF33 was detected using a mouse anti-ORF33 monoclonal antibody, followed by an Alexa Fluor 488-conjugated secondary antibody (green channel). ORF45 was detected using a rabbit anti-ORF45 polyclonal antibody, followed by an Alexa Fluor 647-conjugated secondary antibody (red channel). Nuclei were stained with DAPI (blue channel). Bar: 5 μm. (C) KSHV-ORF52 and EBV-BLRF2 form puncta in COS-7 cells after transfection. Plasmids expressing mCherry-ORF52 (KSHV) or mCherry-BLRF2 (EBV) were transfected into COS-7 cells. Cells were observed with a fluorescence microscope. Bar: 5 μm. (D) FRAP of mCherry-ORF52 homologues in COS-7 cells at 37°C. Bar: 2 μm. (E) A conserved cluster of basic amino acids in the IDR is also required for phase separation of KSHV-ORF52 and EBV-BLRF2. Plasmids expressing KSHV mCherry-ORF52(4A) or EBV mCherry-BLRF2(4A) were transfected into COS-7 cells. Cells were observed with a fluorescence microscope. Bar: 10 μm. (F) Formation of cVACs relies on the phase separation properties of KSHV ORF52. 293T cells were transfected with MHV-68-ORF52-null BAC plus a plasmid expressing KSHV-ORF52 or its 4A mutant. At 48 h post transfection, MHV-68-ORF33 and KSHV-ORF52 were visualized by indirect immunofluorescence. ORF33 was detected using a mouse anti-ORF33 monoclonal antibody, followed by an Alexa Fluor 488-conjugated secondary antibody (green channel). ORF52 was detected using a rabbit anti-flag monoclonal antibody, followed by an Alexa Fluor 555-conjugated secondary antibody (red channel). Nuclei were labeled with DAPI (blue). Bar: 5 μm. (G) Plot of the normalized fluorescence intensity of KSHV-ORF52 (red) and MHV-68-ORF33 (green) along the line in F. Source data are available for this figure: SourceData FS3.

Comment in

Similar articles

Cited by

References

    1. Banani, S.F., Lee H.O., Hyman A.A., and Rosen M.K.. 2017. Biomolecular condensates: Organizers of cellular biochemistry. Nat. Rev. Mol. Cell Biol. 18:285–298. 10.1038/nrm.2017.7 - DOI - PMC - PubMed
    1. Bechtel, J., Grundhoff A., and Ganem D.. 2005. RNAs in the virion of Kaposi’s sarcoma-associated herpesvirus. J. Virol. 79:10138–10146. 10.1128/JVI.79.16.10138-10146.2005 - DOI - PMC - PubMed
    1. Benach, J., Wang L., Chen Y., Ho C.K., Lee S., Seetharaman J., Xiao R., Acton T.B., Montelione G.T., Deng H., et al. . 2007. Structural and functional studies of the abundant tegument protein ORF52 from murine gammaherpesvirus 68. J. Biol. Chem. 282:31534–31541. 10.1074/jbc.M705637200 - DOI - PubMed
    1. Bhowmik, D., Du M., Tian Y., Ma S., Wu J., Chen Z., Yin Q., and Zhu F.. 2021. Cooperative DNA binding mediated by KicGAS/ORF52 oligomerization allows inhibition of DNA-induced phase separation and activation of cGAS. Nucleic Acids Res. 49:9389–9403. 10.1093/nar/gkab689 - DOI - PMC - PubMed
    1. Boeynaems, S., Alberti S., Fawzi N.L., Mittag T., Polymenidou M., Rousseau F., Schymkowitz J., Shorter J., Wolozin B., Van Den Bosch L., et al. . 2018. Protein phase separation: A new phase in cell biology. Trends Cell Biol. 28:420–435. 10.1016/j.tcb.2018.02.004 - DOI - PMC - PubMed

Publication types