. 2022 Sep 29:13:939929.
doi: 10.3389/fphar.2022.939929. eCollection 2022.

BNTA alleviates inflammatory osteolysis by the SOD mediated anti-oxidation and anti-inflammation effect on inhibiting osteoclastogenesis

Affiliations

BNTA alleviates inflammatory osteolysis by the SOD mediated anti-oxidation and anti-inflammation effect on inhibiting osteoclastogenesis

Huidong Wang et al. Front Pharmacol. .

Abstract

Abnormal activation and overproliferation of osteoclast in inflammatory bone diseases lead to osteolysis and bone mass loss. Although current pharmacological treatments have made extensive advances, limitations still exist. N-[2-bromo-4-(phenylsulfonyl)-3-thienyl]-2-chlorobenzamide (BNTA) is an artificially synthesized molecule compound that has antioxidant and anti-inflammatory properties. In this study, we presented that BNTA can suppress intracellular ROS levels through increasing ROS scavenging enzymes SOD1 and SOD2, subsequently attenuating the MARK signaling pathway and the transcription of NFATc1, leading to the inhibition of osteoclast formation and osteolytic resorption. Moreover, the results also showed an obvious restrained effect of BNTA on RANKL-stimulated proinflammatory cytokines, which indirectly mediated osteoclastogenesis. In line with the in vitro results, BNTA protected LPS-induced severe bone loss in vivo by enhancing scavenging enzymes, reducing proinflammatory cytokines, and decreasing osteoclast formation. Taken together, all of the results demonstrate that BNTA effectively represses oxidation, regulates inflammatory activity, and inhibits osteolytic bone resorption, and it may be a potential and exploitable drug to prevent inflammatory osteolytic bone diseases.

Keywords: BNTA; MAPK; SOD; bone loss; inflammatory osteolysis; osteolysis.


Conflict of interest statement

The authors declare that the research was conducted in the absence of any commercial or financial relationships that could be construed as a potential conflict of interest.

Figures

FIGURE 1
FIGURE 1
Effects of N-[2-bromo-4-(phenylsulfonyl)-3-thienyl]-2-chlorobenzamide (BNTA) on the cytotoxicity and proliferation of bone marrow-derived monocytes (BMMs). (A) The chemical structure of BNTA. (B) Viability of BMMs treated by indicated concentrations of BNTA at 24 h (n = 4 per group). (C–F) The proliferation of BMMs treated by indicated concentrations of BNTA at 24, 48, 72, and 96 h (n = 4 per group). All data are presented as mean ± SD.
FIGURE 2
FIGURE 2
BNTA inhibited RANKL-induced osteoclastogenesis and osteolysis in vitro. (A) Representative images of BMMs stained for TRAP showed BNTA inhibited osteoclastogenesis in a dose-dependent manner. BMMs were stimulated by RANKL for 5 days with or without indicated concentrations of BNTA. (B,C) Quantification of TRAP-positive multinucleated cells (nuclei ≥ 3) (n = 4 per group). All data are presented as mean ± SD. ****p < 0.0001 compared with control group. (D) Representative images of hydroxyapatite resorption in each group presented BNTA inhibited osteolysis dose-dependently. BMMs were stimulated by RANKL for 5 days with or without indicated concentrations of BNTA. (E) Quantification of resorbed hydroxyapatite area per well. (n = 3 per group). All data are presented as mean ± SD. ****p < 0.0001 compared with control group.
FIGURE 3
FIGURE 3
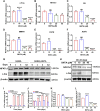
BNTA attenuated osteoclast-related gene expression and inhibited NFATc1 activation. (A–F) qPCR analysis of osteoclast-related gene expression of c-fos, NFATc1, D2, MM9, CSTK, and ACP5 relative to Control in BMMs stimulated by RANKL for 5 days with or without an indicated dose of BNTA (n = 3 per group). All data are presented as mean ± SD. *p < 0.05, **p < 0.01, ***p < 0.001, ****p < 0.0001 compared with control group. (G) Representative Western Blot images of the effect of BNTA on the protein expression of NFATc1 and c-fos on days 0,1, 3, and 5 with the stimulation of RANKL. (H) Representative Western Blot images of the effect of BNTA on the protein expression of NFATc1 and c-fos at day 5 stimulated by RANKL with or without an indicated dose of BNTA. (I–L) Quantitative analysis of the ratio of band intensity of NFATc1 and c-fos relative to β-actin (n = 3 per group). **p < 0.01, ****p < 0.0001 relative to control group.
FIGURE 4
FIGURE 4
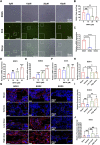
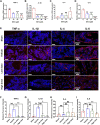
BNTA regulated Redox-related gene expression and inhibited intracellular ROS generation. (A) Representative fluorescence images of RANKL-stimulated ROS production in BMMs with or without pre-treatment of indicated dose of BNTA. (B) Quantification of the number of ROS positive cells per field (n = 3 per group). All data are presented as mean ± SD. *p < 0.05, **p < 0.01. (C) qPCR analysis of mRNA expression of SOD1, SOD2, and SOD3 relative to GAPDH in BMMs stimulated by RANKL for 5 days without stimulation of BNTA (n = 3 per group). All data are presented as mean ± SD. ****p < 0.0001 compared with control group. (D–F) qPCR analysis of redox-related genes expression of SOD1, SOD2, and SOD3 relative to GAPDH in BMMs stimulated by RANKL for 5 days with or without an indicated dose of BNTA (n = 3 per group). All data are presented as mean ± SD. *p < 0.05, ***p < 0.001, ****p < 0.0001 compared with control group. (G) Representative immunofluorescence staining images of decalcified bone sections for protein expression of SOD1, SOD2, and SOD3. (H–J) Quantitative analysis of protein expression of SOD1, SOD2, and SOD3 in vivo. *p < 0.05, **p < 0.01 compared with control group.
FIGURE 5
FIGURE 5
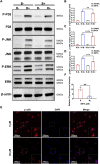
BNTA inhibited osteoclastogenesis via the MAPK signaling pathway. (A) Representative Western Blot images of BNTA on the MAPKs pathway, including p38, ERK, and JNK. (B–D) Quantification of the ratio of band intensity of p-p38/p38, p-JNK/JNK, p-ERK/ERK (n = 3 per group). All data are presented as mean ± SD. **p < 0.01, ***p < 0.001, ****p < 0.0001 compared with control group. (E) Representative immunofluorescence images of the effect of BNTA on the phosphorylation and nucleus translocation of p-p38 with stimulation of RANKL. (F) Quantification of the ratio of fluorescence intensity (n = 3 per group). All data are presented as mean ± SD. **p < 0.01compared with control group.
FIGURE 6
FIGURE 6
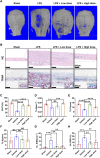
BNTA attenuated LPS-induced bone loss in murine calvaria. (A) Micro-CT and 3-dimensional reconstruction of murine calvaria from sham group (PBS), vehicle group (LPS 5 mg/kg body weight), low dose group (LPS 5 mg/kg and BNTA 0.15 mg/kg) and high dose group (LPS 5 mg/kg and BNTA 1.5 mg/kg). (B) Representative images of decalcified bone sections stained with H&E and TRAP from each group. (C–H) Quantitative analysis of BV/TV, Tb.N, Tb.Th, Tb. sp, Oc. N/BS and Oc. S/BS in tissue sections. (n = 5). All data are presented as mean ± SD. **p < 0.01, ***p < 0.001 ****p < 0.0001. TRAP, tartrate resistant acid phosphatase; HE, hematoxylin and eosin; BV/TV, bone volume per tissue volume; Tb.N, trabecular number; Tb.Th, trabecular thickness; Tb. sp, trabecular space; Oc. N/BS, osteoclast number/bone surface; Oc. S/BS, osteoclast surface/bone surface.
FIGURE 7
FIGURE 7
BNTA regulated inflammation-related gene expression. (A–D) qPCR analysis of inflammation-related genes expression of TNF-α, IL1-β, IL-4, and IL-6 relative to GAPDH in BMMs stimulated by RANKL for 5 days with or without an indicated dose of BNTA (n = 3 per group). All data are presented as mean ± SD. *p < 0.05, **p < 0.01, ***p < 0.001, ****p < 0.0001 compared with control group. (E) Representative immunofluorescence staining images of decalcified bone sections for protein expression of TNF-α, IL1-β, IL-4, and IL-6. (F–I) Quantitative analysis of protein expression of TNF-α, IL1-β, IL-4, and IL-6 in vivo (n = 5 per group). All data are presented as mean ± SD. *p < 0.05, **p < 0.01 compared with control group.
FIGURE 8
FIGURE 8
A proposed scheme of BNTA for the inhibitory influence of inflammatory osteoclastogenesis and osteolytic bone resorption.

Similar articles

Cited by

References

    1. Agidigbi T. S., Kim C. (2019). Reactive oxygen species in osteoclast differentiation and possible pharmaceutical targets of ROS-mediated osteoclast diseases. Int. J. Mol. Sci. 20 (14), E3576. 10.3390/ijms20143576 - DOI - PMC - PubMed
    1. Al-Khan A. A., Al Balushi N. R., Richardson S. J., Danks J. A. (2021). Roles of parathyroid hormone-related protein (PTHrP) and its receptor (PTHR1) in normal and tumor tissues: Focus on their roles in osteosarcoma. Front. Vet. Sci. 8, 637614. 10.3389/fvets.2021.637614 - DOI - PMC - PubMed
    1. Boyle W. J., Simonet W. S., Lacey D. L. (2003). Osteoclast differentiation and activation. Nature 423 (6937), 337–342. 10.1038/nature01658 - DOI - PubMed
    1. Chen K., Qiu P., Yuan Y., Zheng L., He J., Wang C., et al. (2019). Pseurotin A inhibits osteoclastogenesis and prevents ovariectomized-induced bone loss by suppressing reactive oxygen species. Theranostics 9 (6), 1634–1650. 10.7150/thno.30206 - DOI - PMC - PubMed
    1. Chen X., Chen X., Zhou Z., Qin A., Wang Y., Fan B., et al. (2019). LY411575, a potent gamma-secretase inhibitor, suppresses osteoclastogenesis in vitro and LPS-induced calvarial osteolysis in vivo . J. Cell. Physiol. 234 (11), 20944–20956. 10.1002/jcp.28699 - DOI - PubMed