SARS-CoV-2 variants Alpha, Beta, Delta and Omicron show a slower host cell interferon response compared to an early pandemic variant
- PMID: 36248817
- PMCID: PMC9561549
- DOI: 10.3389/fimmu.2022.1016108
SARS-CoV-2 variants Alpha, Beta, Delta and Omicron show a slower host cell interferon response compared to an early pandemic variant
Abstract
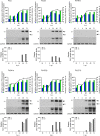
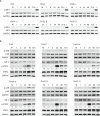
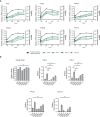
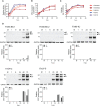
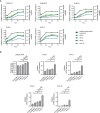
Since the start of the pandemic at the end of 2019, arising mutations in SARS-CoV-2 have improved its transmission and ability to circumvent the immunity induced by vaccination and previous COVID-19 infection. Studies on the effects of SARS-CoV-2 genomic mutations on replication and innate immunity will give us valuable insight into the evolution of the virus which can aid in further development of vaccines and new treatment modalities. Here we systematically analyzed the kinetics of virus replication, innate immune activation, and host cell antiviral response patterns in Alpha, Beta, Delta, Kappa, Omicron and two early pandemic SARS-CoV-2 variant-infected human lung epithelial Calu-3 cells. We observed overall comparable replication patterns for these variants with modest variations. Particularly, the sublineages of Omicron BA.1, BA.2 and a recombinant sublineage, XJ, all showed attenuated replication in Calu-3 cells compared to Alpha and Delta. Furthermore, there was relatively weak activation of primary innate immune signaling pathways, however, all variants produced enough interferons to induce the activation of STAT2 and production of interferon stimulated genes (ISGs). While interferon mRNA expression and STAT2 activation correlated with cellular viral RNA levels, ISG production did not. Although clear cut effects of specific SARS-CoV-2 genomic mutations could not be concluded, the variants of concern, including Omicron, showed a lower replication efficiency and a slower interferon response compared to an early pandemic variant in the study.
Keywords: Omicron; SARS-CoV-2; innate immunity; interferon; mutations; replication; variants.
Copyright © 2022 Laine, Skön, Väisänen, Julkunen and Österlund.
Conflict of interest statement
The authors declare that the research was conducted in the absence of any commercial or financial relationships that could be construed as a potential conflict of interest.
Figures



Similar articles
-
Antiviral Activity of Type I, II, and III Interferons Counterbalances ACE2 Inducibility and Restricts SARS-CoV-2.mBio. 2020 Sep 10;11(5):e01928-20. doi: 10.1128/mBio.01928-20. mBio. 2020. PMID: 32913009 Free PMC article.
-
SARS-CoV-2 Variant Delta Potently Suppresses Innate Immune Response and Evades Interferon-Activated Antiviral Responses in Human Colon Epithelial Cells.Microbiol Spectr. 2022 Oct 26;10(5):e0160422. doi: 10.1128/spectrum.01604-22. Epub 2022 Sep 8. Microbiol Spectr. 2022. PMID: 36073824 Free PMC article.
-
SARS-CoV-2 Isolates Show Impaired Replication in Human Immune Cells but Differential Ability to Replicate and Induce Innate Immunity in Lung Epithelial Cells.Microbiol Spectr. 2021 Sep 3;9(1):e0077421. doi: 10.1128/Spectrum.00774-21. Epub 2021 Aug 11. Microbiol Spectr. 2021. PMID: 34378952 Free PMC article.
-
Characterization of SARS-CoV-2 Evasion: Interferon Pathway and Therapeutic Options.Viruses. 2022 Jun 8;14(6):1247. doi: 10.3390/v14061247. Viruses. 2022. PMID: 35746718 Free PMC article. Review.
-
Characterization of SARS-CoV-2 recombinants and emerging Omicron sublineages.Int J Med Sci. 2023 Jan 1;20(1):151-162. doi: 10.7150/ijms.79116. eCollection 2023. Int J Med Sci. 2023. PMID: 36619228 Free PMC article. Review.
Cited by
-
Differential RNA editing landscapes in host cell versus the SARS-CoV-2 genome.iScience. 2023 Sep 30;26(11):108031. doi: 10.1016/j.isci.2023.108031. eCollection 2023 Nov 17. iScience. 2023. PMID: 37876814 Free PMC article.
-
Infectious viruses from transfected SARS-CoV-2 genomic RNA.Front Bioeng Biotechnol. 2023 Mar 30;11:1129111. doi: 10.3389/fbioe.2023.1129111. eCollection 2023. Front Bioeng Biotechnol. 2023. PMID: 37064222 Free PMC article.
-
On the Evolutionary Trajectory of SARS-CoV-2: Host Immunity as a Driver of Adaptation in RNA Viruses.Viruses. 2022 Dec 26;15(1):70. doi: 10.3390/v15010070. Viruses. 2022. PMID: 36680110 Free PMC article. Review.
-
Interferon signaling in the nasal epithelium distinguishes among lethal and common cold respiratory viruses and is critical for viral clearance.bioRxiv [Preprint]. 2023 Dec 19:2023.12.18.571720. doi: 10.1101/2023.12.18.571720. bioRxiv. 2023. Update in: Proc Natl Acad Sci U S A. 2024 May 21;121(21):e2402540121. doi: 10.1073/pnas.2402540121 PMID: 38187597 Free PMC article. Updated. Preprint.
-
SARS-CoV-2 variants induce increased inflammatory gene expression but reduced interferon responses and heme synthesis as compared with wild type strains.Sci Rep. 2024 Oct 28;14(1):25734. doi: 10.1038/s41598-024-76401-1. Sci Rep. 2024. PMID: 39468120 Free PMC article.
References
-
- World Health Organization . WHO coronavirus (COVID-19) dashboard. Available at: https://covid19.who.int (Accessed August 8, 2022).
-
- Ilmjärv S, Abdul F, Acosta-Gutiérrez S, Estarellas C, Galdadas I, Casimir M, et al. . Concurrent mutations in RNA-dependent RNA polymerase and spike protein emerged as the epidemiologically most successful SARS-CoV-2 variant. Sci Rep (2021) 11:13705. doi: 10.1038/s41598-021-91662-w - DOI - PMC - PubMed
Publication types
MeSH terms
Substances
Supplementary concepts
LinkOut - more resources
Full Text Sources
Medical
Miscellaneous

