

Exenatide improves hepatocyte insulin resistance induced by different regional adipose tissue
- PMID: 36246878
- PMCID: PMC9558273
- DOI: 10.3389/fendo.2022.1012904
Exenatide improves hepatocyte insulin resistance induced by different regional adipose tissue
Abstract
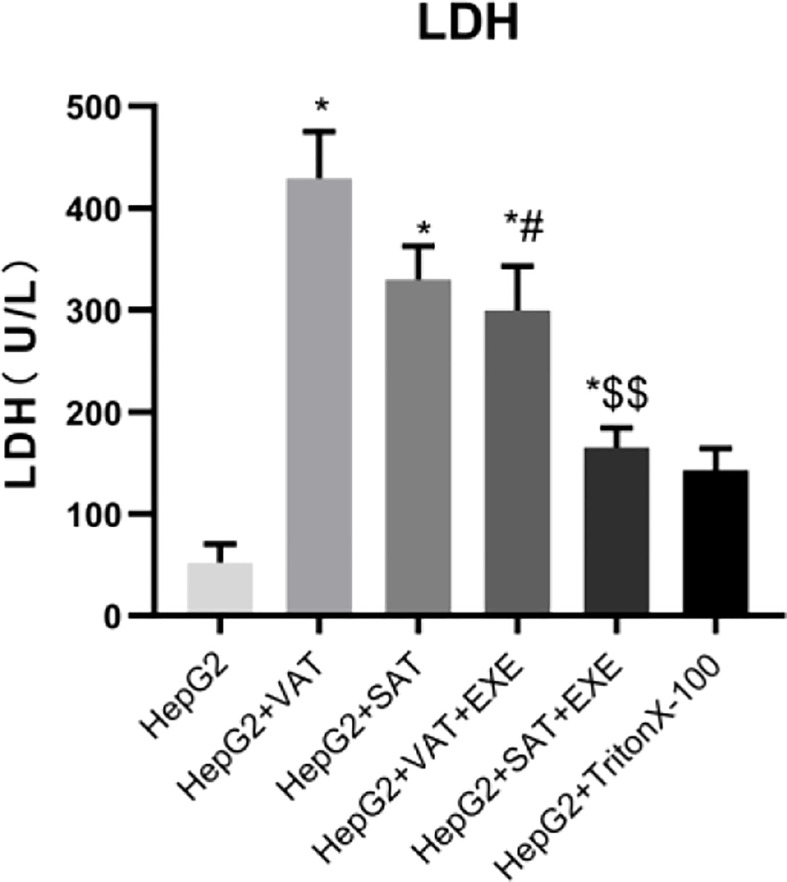
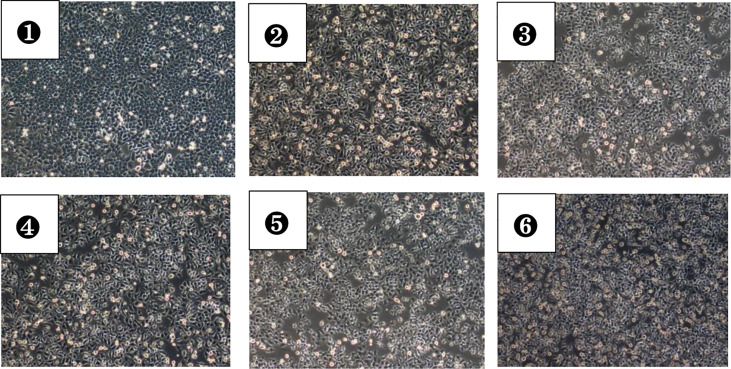
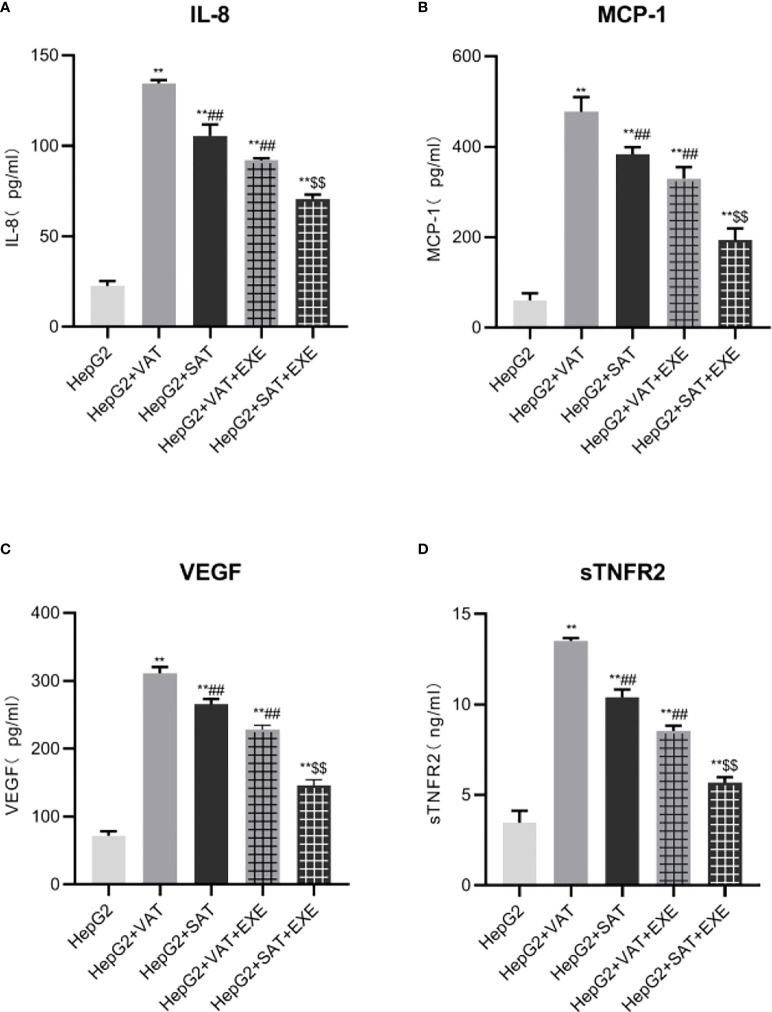
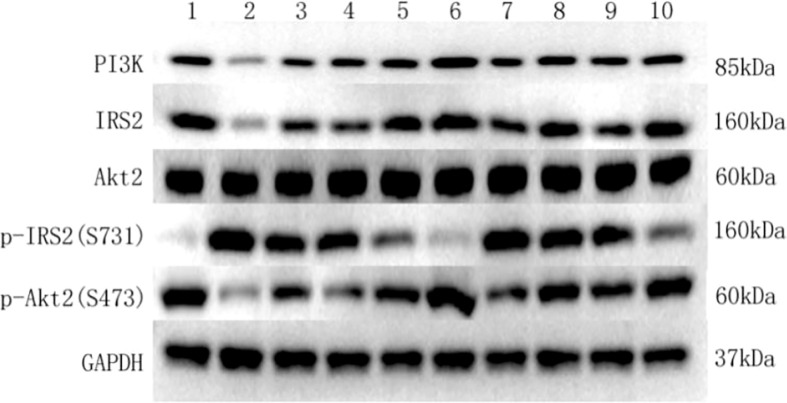
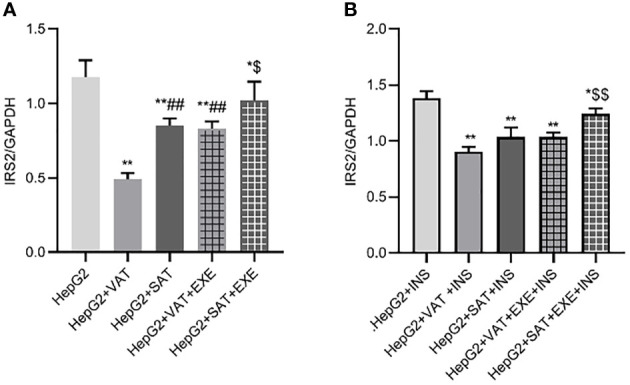
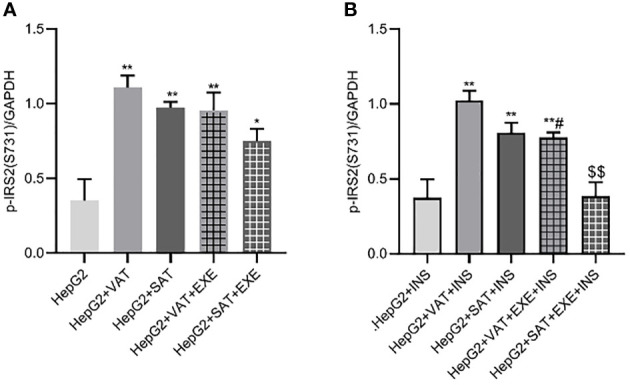
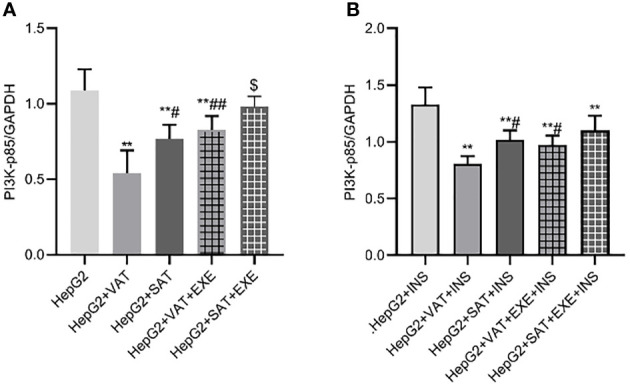
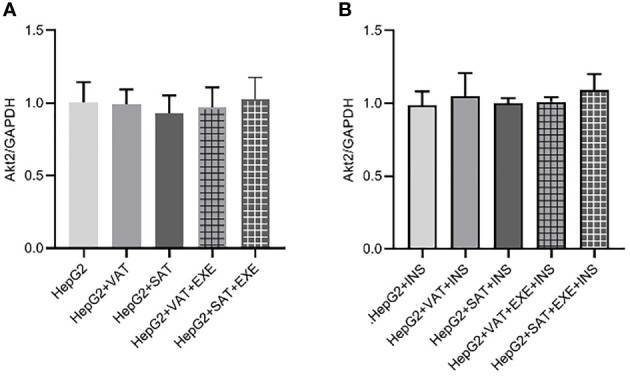
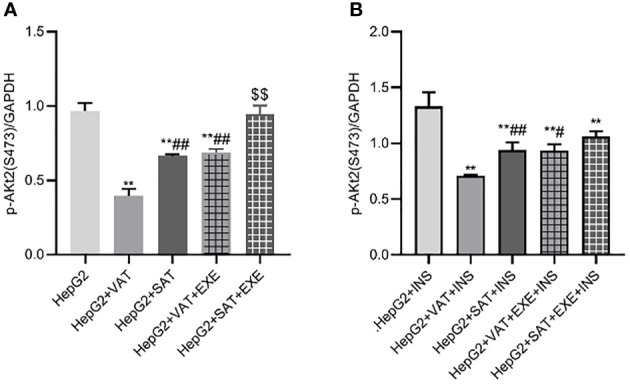
Obesity is resulted from energy surplus and is characterized by abnormal adipose tissue accumulation and/or distribution. Adipokines secreted by different regional adipose tissue can induce changes in key proteins of the insulin signaling pathway in hepatocytes and result in impaired hepatic glucose metabolism. This study aimed to investigate whether exenatide affects key proteins of IRS2/PI3K/Akt2 signaling pathway in hepatocytes altered by the different regional fat depots. Six non-obese patients without endocrine diseases were selected as the research subjects. Their subcutaneous adipose tissue (SAT) and visceral adipose tissue (VAT)were co-cultured with HepG2 cells in the transwell chamber. In the presence or absence of exenatide, adipokines content in the supernatant of each experimental group was detected by ELISA. In addition, HepG2 cells in each co-culture group with and without insulin were collected, and the expression of key proteins IRS2, p-IRS2(S731), PI3K-p85, Akt2, and p-Akt2(S473) was detected by western blotting (WB). The results showed that the adipokines IL-8, MCP-1, VEGF, and sTNFR2 in the supernatant of HepG2 cells induced by different regional adipose tissue were significantly higher than those in the HepG2 group, and VAT released more adipokines than SAT. Furthermore, these adipokines were significantly inhibited by exenatide. Importantly, the different regional fat depot affects the IRS2/PI3K/Akt2 insulin signaling pathway of hepatocytes. Exenatide can up-regulate the expression of hepatocyte proteins IRS2, PI3K-p85, p-Akt2(S731) inhibited by adipose tissue, and down-regulate the expression of hepatocyte proteins p-IRS2(S731) promoted by adipose tissue. The effect of VAT on the expression of these key proteins in hepatocytes is more significant than that of SAT. But there was no statistical difference in the expression of Akt2 protein among each experimental group, suggesting that exenatide has no influence on the expression of Akt2 protein in hepatocytes. In conclusion, exenatide may improve hepatic insulin resistance (IR) by inhibiting adipokines and regulating the expression of key proteins in the IRS2/PI3K/Akt2 pathway.
Keywords: GLP-1; adipose tissue; exenatide; incretin; insulin resistance; obesity.
Copyright © 2022 Bai, Wang, Niu, Guan, Huang, Nian, Zuo, Zhao, Kazumi and Wu.
Conflict of interest statement
The authors declare that the research was conducted in the absence of any commercial or financial relationships that could be construed as a potential conflict of interest.
Figures
Similar articles
-
Exploring Visceral and Subcutaneous Adipose Tissue Secretomes in Human Obesity: Implications for Metabolic Disease.Endocrinology. 2022 Oct 11;163(11):bqac140. doi: 10.1210/endocr/bqac140. Endocrinology. 2022. PMID: 36036084 Free PMC article.
-
Three-dimensional culture model for analyzing crosstalk between adipose tissue and hepatocytes.Cell Tissue Res. 2013 Jun;352(3):611-21. doi: 10.1007/s00441-013-1588-8. Epub 2013 Mar 20. Cell Tissue Res. 2013. PMID: 23512139
-
Subcutaneous and visceral adipose tissue gene expression of serum adipokines that predict type 2 diabetes.Obesity (Silver Spring). 2010 May;18(5):884-9. doi: 10.1038/oby.2009.443. Epub 2009 Dec 17. Obesity (Silver Spring). 2010. PMID: 20019678
-
Depot-specific hormonal characteristics of subcutaneous and visceral adipose tissue and their relation to the metabolic syndrome.Horm Metab Res. 2002 Nov-Dec;34(11-12):616-21. doi: 10.1055/s-2002-38256. Horm Metab Res. 2002. PMID: 12660870 Review.
-
Secreted proteins from adipose tissue and skeletal muscle - adipokines, myokines and adipose/muscle cross-talk.Arch Physiol Biochem. 2011 May;117(2):47-56. doi: 10.3109/13813455.2010.535835. Epub 2010 Dec 15. Arch Physiol Biochem. 2011. PMID: 21158485 Review.
Cited by
-
Restoring autophagic function: a case for type 2 diabetes mellitus drug repurposing in Parkinson's disease.Front Neurosci. 2023 Nov 3;17:1244022. doi: 10.3389/fnins.2023.1244022. eCollection 2023. Front Neurosci. 2023. PMID: 38027497 Free PMC article. Review.
References
Publication types
MeSH terms
Substances
LinkOut - more resources
Full Text Sources
Research Materials
Miscellaneous