

Entropy sorting of single-cell RNA sequencing data reveals the inner cell mass in the human pre-implantation embryo
- PMID: 36240776
- PMCID: PMC9859930
- DOI: 10.1016/j.stemcr.2022.09.007
Entropy sorting of single-cell RNA sequencing data reveals the inner cell mass in the human pre-implantation embryo
Abstract
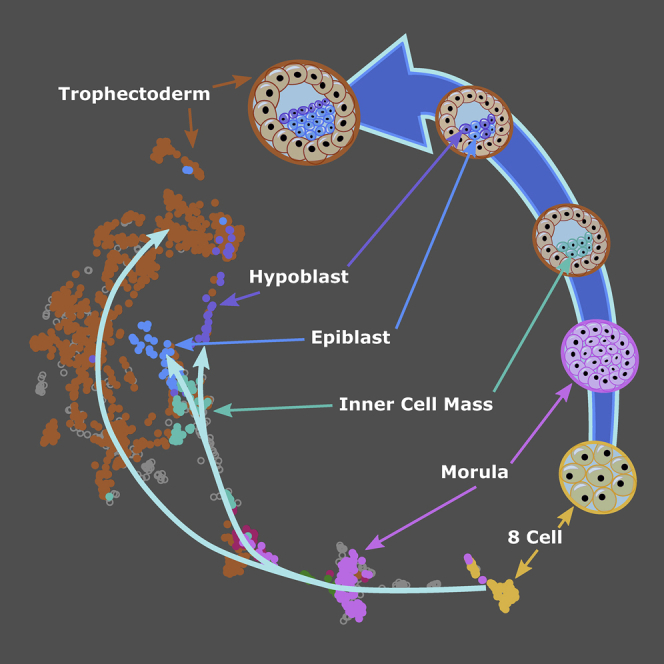
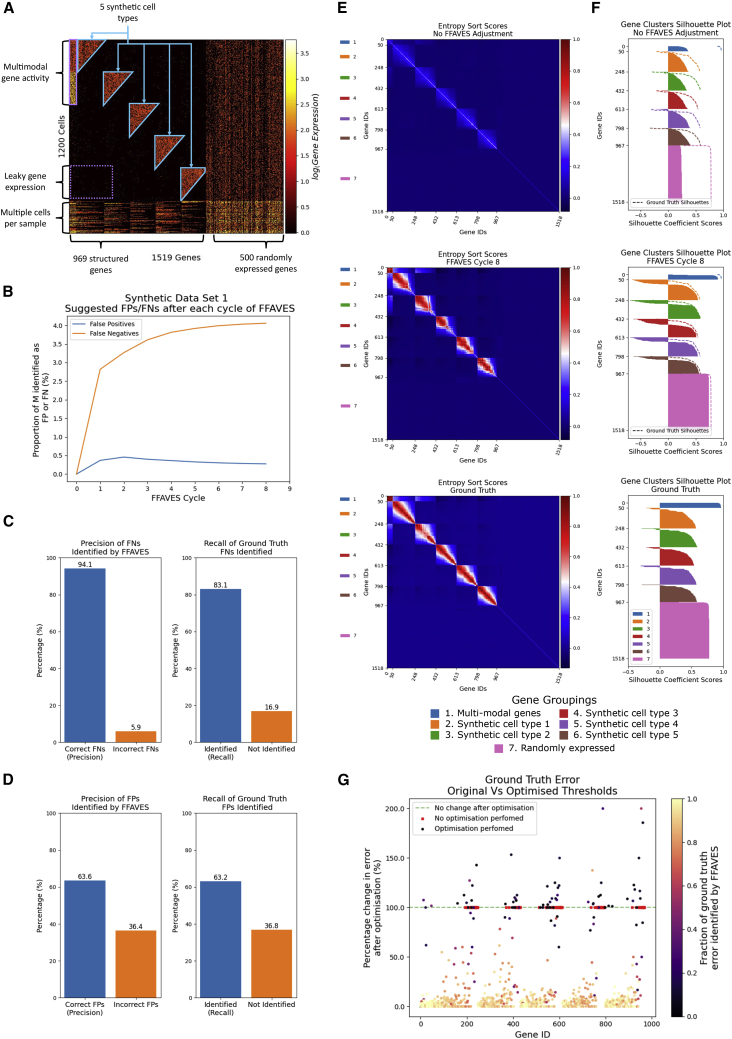
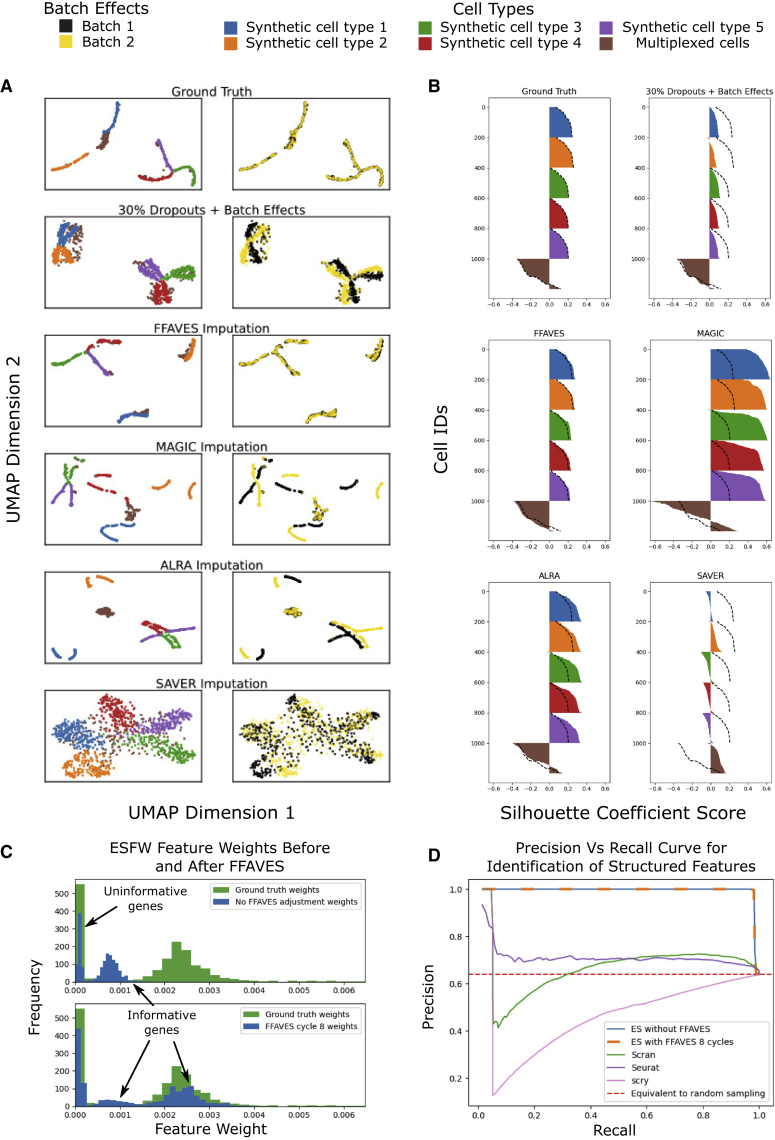
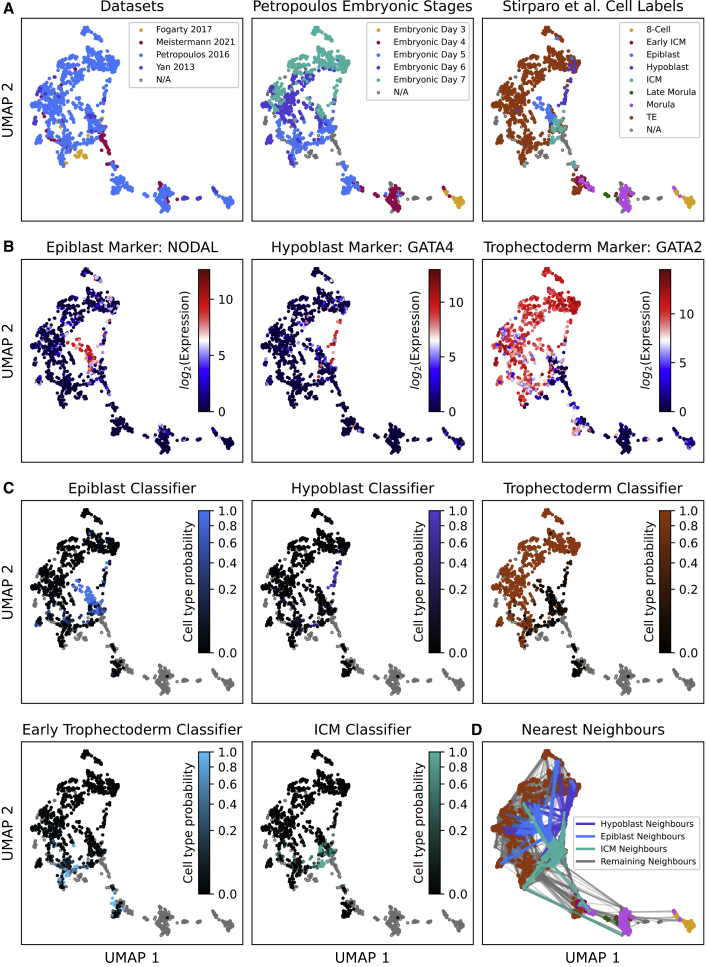
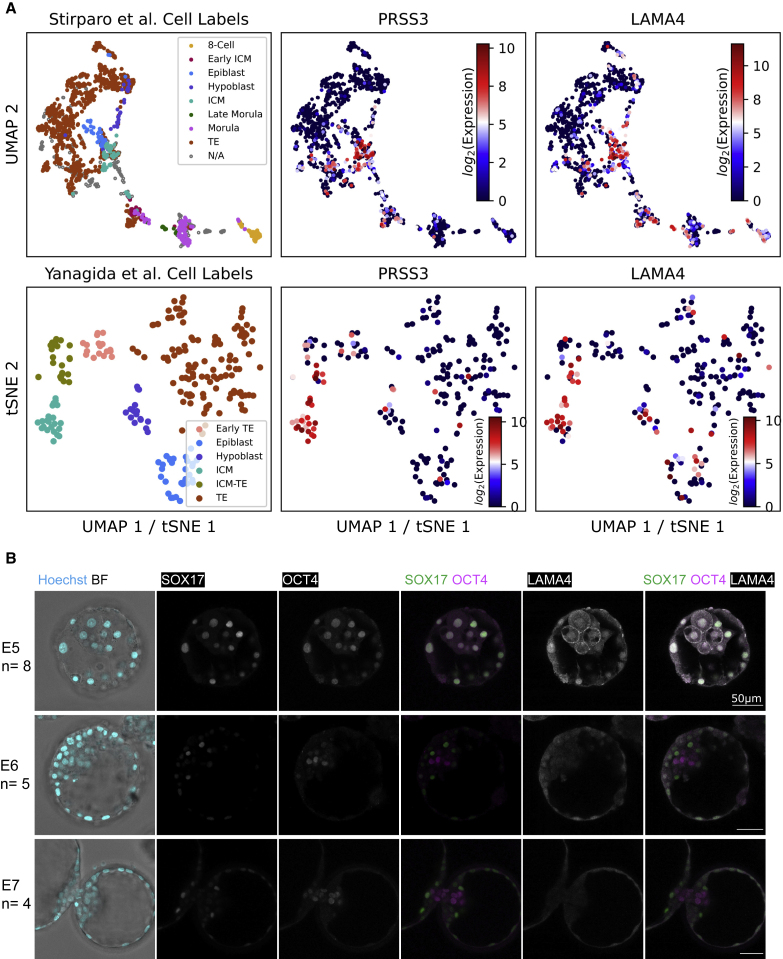
A major challenge in single-cell gene expression analysis is to discern meaningful cellular heterogeneity from technical or biological noise. To address this challenge, we present entropy sorting (ES), a mathematical framework that distinguishes genes indicative of cell identity. ES achieves this in an unsupervised manner by quantifying if observed correlations between features are more likely to have occurred due to random chance versus a dependent relationship, without the need for any user-defined significance threshold. On synthetic data, we demonstrate the removal of noisy signals to reveal a higher resolution of gene expression patterns than commonly used feature selection methods. We then apply ES to human pre-implantation embryo single-cell RNA sequencing (scRNA-seq) data. Previous studies failed to unambiguously identify early inner cell mass (ICM), suggesting that the human embryo may diverge from the mouse paradigm. In contrast, ES resolves the ICM and reveals sequential lineage bifurcations as in the classical model. ES thus provides a powerful approach for maximizing information extraction from high-dimensional datasets such as scRNA-seq data.
Keywords: feature selection; human embryo inner cell mass; single-cell RNA sequencing.
Copyright © 2022 The Authors. Published by Elsevier Inc. All rights reserved.
Conflict of interest statement
Conflict of interests Sara-Jane Dunn was an employee at Microsoft Research during this study and is currently employed at DeepMind. Microsoft Research provided co-funding for Arthur Radley’s research council studentship and access to computational resources. Neither Microsoft Research nor DeepMind have directed any aspect of the study nor exerted any commercial rights over the results.
Figures
Similar articles
-
Branching topology of the human embryo transcriptome revealed by Entropy Sort Feature Weighting.Development. 2024 Jun 1;151(11):dev202832. doi: 10.1242/dev.202832. Epub 2024 Jun 13. Development. 2024. PMID: 38691188 Free PMC article.
-
Intrinsic entropy model for feature selection of scRNA-seq data.J Mol Cell Biol. 2022 Jun 8;14(2):mjac008. doi: 10.1093/jmcb/mjac008. J Mol Cell Biol. 2022. PMID: 35102420 Free PMC article.
-
LINEAGE: Label-free identification of endogenous informative single-cell mitochondrial RNA mutation for lineage analysis.Proc Natl Acad Sci U S A. 2022 Feb 1;119(5):e2119767119. doi: 10.1073/pnas.2119767119. Proc Natl Acad Sci U S A. 2022. PMID: 35086932 Free PMC article.
-
Lineage segregation in human pre-implantation embryos is specified by YAP1 and TEAD1.Hum Reprod. 2023 Aug 1;38(8):1484-1498. doi: 10.1093/humrep/dead107. Hum Reprod. 2023. PMID: 37295962
-
Selecting gene features for unsupervised analysis of single-cell gene expression data.Brief Bioinform. 2021 Nov 5;22(6):bbab295. doi: 10.1093/bib/bbab295. Brief Bioinform. 2021. PMID: 34351383 Free PMC article. Review.
Cited by
-
Evidence implicating sequential commitment of the founder lineages in the human blastocyst by order of hypoblast gene activation.Development. 2023 May 15;150(10):dev201522. doi: 10.1242/dev.201522. Epub 2023 May 24. Development. 2023. PMID: 37102672 Free PMC article.
-
The human embryo selection arena is associated with transposable element activity.PLoS Biol. 2023 Jun 20;21(6):e3002153. doi: 10.1371/journal.pbio.3002153. eCollection 2023 Jun. PLoS Biol. 2023. PMID: 37348048 Free PMC article.
-
Accessing the human trophoblast stem cell state from pluripotent and somatic cells.Cell Mol Life Sci. 2022 Nov 25;79(12):604. doi: 10.1007/s00018-022-04549-y. Cell Mol Life Sci. 2022. PMID: 36434136 Free PMC article. Review.
-
Self-renewing human naïve pluripotent stem cells dedifferentiate in 3D culture and form blastoids spontaneously.Nat Commun. 2024 Jan 22;15(1):668. doi: 10.1038/s41467-024-44969-x. Nat Commun. 2024. PMID: 38253551 Free PMC article.
-
Branching topology of the human embryo transcriptome revealed by Entropy Sort Feature Weighting.Development. 2024 Jun 1;151(11):dev202832. doi: 10.1242/dev.202832. Epub 2024 Jun 13. Development. 2024. PMID: 38691188 Free PMC article.
References
-
- Altman N., Krzywinski M. The curse(s) of dimensionality. 2018;15:399–400. - PubMed
-
- Angerer P., Simon L., Tritschler S., Wolf F.A., Fischer D., Theis F.J. Single cells make big data: new challenges and opportunities in transcriptomics. Curr. Opin. Syst. Biol. 2017;4:85–91. doi: 10.1016/J.COISB.2017.07.004. - DOI
Publication types
MeSH terms
Grants and funding
- G1100526/MRC_/Medical Research Council/United Kingdom
- MR/W025310/1/MRC_/Medical Research Council/United Kingdom
- MR/P010423/1/MRC_/Medical Research Council/United Kingdom
- G1100526/1/MRC_/Medical Research Council/United Kingdom
- BB/P021573/1/BB_/Biotechnology and Biological Sciences Research Council/United Kingdom
LinkOut - more resources
Full Text Sources
