. 2022 Oct 14;8(41):eabm1847.
doi: 10.1126/sciadv.abm1847. Epub 2022 Oct 14.

Cellular shape reinforces niche to stem cell signaling in the small intestine

Affiliations

Cellular shape reinforces niche to stem cell signaling in the small intestine

Nalle Pentinmikko et al. Sci Adv. .

Abstract

Niche-derived factors regulate tissue stem cells, but apart from the mechanosensory pathways, the effect of niche geometry is not well understood. We used organoids and bioengineered tissue culture platforms to demonstrate that the conical shape of Lgr5+ small intestinal stem cells (ISCs) facilitate their self-renewal and function. Inhibition of non-muscle myosin II (NM II)-driven apical constriction altered ISC shape and reduced niche curvature and stem cell capacity. Niche curvature is decreased in aged mice, suggesting that suboptimal interactions between old ISCs and their niche develop with age. We show that activation of NM IIC or physical restriction to young topology improves in vitro regeneration by old epithelium. We propose that the increase in lateral surface area of ISCs induced by apical constriction promotes interactions between neighboring cells, and the curved topology of the intestinal niche has evolved to maximize signaling between ISCs and neighboring cells.


Figures

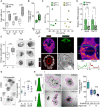
Fig. 1.
Fig. 1.. Apical constriction required for ISC function.
(A) Immunostaining of intestinal crypt. Lgr5-EGFP (green), lysozyme (red), DNA (blue), and E-cadherin (white). (B) Intestinal organoids stained with phalloidin (F-actin) (top) and E-cadherin (bottom). Inset: Surface plot of the organoid crypt domains. Positive (green), zero (gray), and negative (red) Gaussian curvature (G). (C) Quantification of ISC, TA, and Paneth cell morphology in organoids. (D) Left: Sagittal plane of isolated crypt. Lgr5-EGFP (green), E-cadherin (white), DNA (blue), and phosphorylated myosin regulatory light chain (pMRLC; fire). ISCs (green arrowhead) show higher pMRLC intensity apically (green arrow) compared with Paneth cells (red arrowhead). Distribution of pMRLC in Paneth and ISCs: B, basal and A, apical. Right: Coronal plane visualizing presence and lack of apical pMRLC in ISCs (L) and Paneth cells (P). (E) Myh9 knockout induced with 4-hydroxytamoxifen (4-OHT) 2 days after passage in Villin-CreERT2;Myh9fl/fl;Rosa26mTmG/+ mouse–derived organoids. Images 6 days after passage. Note that membrane-localized EGFP (mGFP) is absent in vehicle-treated organoids. Asterisk, luminal background. (F and G) Crypt width and crypt number in organoids from (E) (n = 4). (H) Schematics and images from organoids treated 48 hours with dimethyl sulfoxide (DMSO) (D), Y-27632 (Y), or Blebbistatin (B), E-cadherin (magenta), lysozyme (yellow), and DNA (blue). (I and J) Crypt width and number after treatment (n = 4 replicate wells). (K) ISC and TA cell frequencies from Lgr5-EGFP-IRES-CreERT2 mouse–derived organoids relative to Paneth cell number (n = 5). (L) Organoid treatment schematics and ISC morphology after 48 hours of exposure to inhibitors. (M) Crypt diameter after 48 hours of exposure to inhibitors (n = 6). (N) Regenerative capacity of subcultured crypt domains in the absence of inhibitors. n values represent independent experiments. Unless otherwise indicated, in box plots, the line represents median, the box shows interquartile range, and whiskers indicate the range. All other data are represented as means ± SD. P values are shown in corresponding panels. Scale bars, 10 μm (A and D) and 50 μm (B, E, and H). a.u., arbitrary units.
Fig. 2.
Fig. 2.. Bioengineered scaffold mimicking native crypt curvature supports ISC function.
(A) Schematics of the photolithography technique used to prepare rounded-bottom collagen scaffolds. Representative images of the 50-μm PDMS (bright field; scale bar, 50 μm) or collagen [scanning electron microscopy (SEM); scale bar, 10 μm] scaffolds prepared using the technique. (B) Timeline for the established epithelial cultured originating from isolated Lgr5hi ISCs. Maximum projection image of a formed crypt. DNA (blue), Lgr5-EGFP (green), and lysozyme (red). Schematic showing location of the regions of interest (ROIs) used in analysis. Scale bar, 25 μm. (C) Left: Single plane images of bottom, middle, and top layer of the immunostained crypt. Right: Quantification of crypt domains formed on collagen scaffolds. n = 3. (D) Quantification of 4′,6-diamidino-2-phenylindole (DAPI)–normalized intensity of GFP from Lgr5-EGFP-IRES-CreERT2 mouse–derived epithelium grown on various-sized (50 to 125 μm) collagen scaffolds. Data are represented in relation to the flat surface. n = 3 independent experiments. (E) Quantification of the capacity to maintain crypts populated after prolonged culture on various crypt sizes. n = 5 independent experiments. (F) Growth capacity of epithelium cultured on 50-μm collagen scaffold of 48 hours with 20 μM Y-27632 (Y), 10 μM Blebbistatin (B), or vehicle (DMSO) (D). n = 3 independent experiments. (G) Quantification of ISC volume from epithelium grown on 50- and 100-μm scaffolds. n = 4 independent experiments. Unless otherwise indicated, in box plots, the line represents median, the box shows interquartile range and whiskers show the range. All other data are represented as means ± SD. P values are shown in corresponding panels. n.s., not significant.
Fig. 3.
Fig. 3.. Increased surface-to-volume ratio promotes signaling capacity between Paneth and ISCs.
(A) Relation between the apical constriction and lateral surface area to volume ratio. Basal width and cell height reflects the mean observed values from cells in organoid crypt domains. Diameter of apical and middle position varies from 0 to 8 μm. (B) Volumes (V %) of the corresponding ISCs and TA cells presented in relation to the smallest within respective groups. Scale bar, 5 μm (C) Left: Colony forming capacity of isolated S-ISCs and L-ISCs in the absence of Paneth cells or external Wnt supplementation. Colonies quantified and representative images taken on day 5. n = 5 animals. Right: Organoid forming capacity of S-ISCs and L-ISCs when cocultured together with the Paneth cell niche. Organoids quantified and representative images taken on day 6. n = 9 animals. (D) Quantification of nuclear NICD in Lgr5+ ISCs cultured on 50- or 100-μm scaffolds. Data represented in relation to average ISC on 50-μm scaffolds. n = 4 crypts quantified. (E) Representative images of TOP-GFP organoids culture for 24 hours with NM II inhibitors. (F) Left: Representative TOP-GFP histogram from flow analysis of ISC containing population CD24medSSClo (see fig. S5L for gating strategy). Right: Quantification of the flow analysis. Data are represented in relation to the average of DMSO control. n = 6 (for DMSO and Y27632) or 4 (Blebbistatin) replicate cultures from two independent experiments. Unless otherwise indicated, in box plots, the line represents median, the box shows interquartile range, and whiskers show the range. All other data are represented as means ± SD. P values are shown in corresponding panels. Unless otherwise noted, scale bars are 50 μm.
Fig. 4.
Fig. 4.. Young topology enhances regenerative capacity of old ISCs.
(A) Quantification of crypt width from resected intestinal sections of young (Y) and old (O) animals. n = 5 animals per group. (B) Analysis of the ISC size by flow cytometry. n = 5 animals per group. (C) Two-dimensional (2D) principal components analysis of mRNA-profiled young and old Lgr5hi (ISCs) and Lgr5lo (TA) cells. n = 3 animals per group. (D) Expression of NM II heavy chain coding genes Myh9 and Myh14 in young and old ISCs. n = 6 young and 10 old. Fold chain compared to young ISCs. Means ± SD. (E) Quantification and representative images of 2-day-old organoids derived from young and old mice and cultured in the absence of Y-27632. Scale bar, 50 mm. (F) Left: Immunofluorescent staining of organoid crypt domain demonstrating apical localization of Myh14 (fire) in ISCs (Lgr5-EGFP, green). DNA (DAPI, white) and phalloidin (red) were used to identify cell borders. Scale bar, 10 μm. Right: Myh14 staining and quantification of basal (B) to apical (A) distribution along the ISC (green line) and Paneth cell (red line). n = 3 cell pairs analyzed with similar outcome. (G) Left: Representative images of old organoids grown for 4 days in the presence of 500 μM 4HAP or vehicle. Scale bar, 50 μm. Right: Regenerative growth of young and old organoids supplemented with 500 μM 4HAP or vehicle. (H) Quantification of old ISC shape cultured 4 days in the presence of 4HAP or vehicle. n = 31 cells. (I) Representative images and quantification of epithelial area of young or old organoids grown on 50- or 100-μm scaffolds. Scale bar, 200 μm. n = 4 animals per group. Unless otherwise indicated, in box plots, the line represents median, the box shows interquartile range, and whiskers show the range. All other data are represented as means ± SD. P values are shown in corresponding panels.

Similar articles

Cited by

References

    1. Chacon-Martinez C. A., Koester J., Wickstrom S. A., Signaling in the stem cell niche: Regulating cell fate, function and plasticity. Development 145, dev165399 (2018). - PubMed
    1. Nelson C. M., Bissell M. J., Of extracellular matrix, scaffolds, and signaling: Tissue architecture regulates development, homeostasis, and cancer. Annu. Rev. Cell Dev. Biol. 22, 287–309 (2006). - PMC - PubMed
    1. Guignard L., Fiúza U.-M., Leggio B., Laussu J., Faure E., Michelin G., Biasuz K., Hufnagel L., Malandain G., Godin C., Lemaire P., Contact area-dependent cell communication and the morphological invariance of ascidian embryogenesis. Science 369, eaar5663 (2020). - PubMed
    1. Barker N., Adult intestinal stem cells: Critical drivers of epithelial homeostasis and regeneration. Nat. Rev. Mol. Cell Biol. 15, 19–33 (2014). - PubMed
    1. Pentinmikko N., Iqbal S., Mana M., Andersson S., Cognetta A. B. III, Suciu R. M., Roper J., Luopajärvi K., Markelin E., Gopalakrishnan S., Smolander O.-P., Naranjo S., Saarinen T., Juuti A., Pietiläinen K., Auvinen P., Ristimäki A., Gupta N., Tammela T., Jacks T., Sabatini D. M., Cravatt B. F., Yilmaz Ö. H., Katajisto P., Notum produced by Paneth cells attenuates regeneration of aged intestinal epithelium. Nature 571, 398–402 (2019). - PMC - PubMed