. 2022 Nov 19;23(6):bbac445.
doi: 10.1093/bib/bbac445.

A universal model of RNA.DNA:DNA triplex formation accurately predicts genome-wide RNA-DNA interactions

Affiliations

A universal model of RNA.DNA:DNA triplex formation accurately predicts genome-wide RNA-DNA interactions

Timothy Warwick et al. Brief Bioinform. .

Abstract

RNA.DNA:DNA triple helix (triplex) formation is a form of RNA-DNA interaction which regulates gene expression but is difficult to study experimentally in vivo. This makes accurate computational prediction of such interactions highly important in the field of RNA research. Current predictive methods use canonical Hoogsteen base pairing rules, which whilst biophysically valid, may not reflect the plastic nature of cell biology. Here, we present the first optimization approach to learn a probabilistic model describing RNA-DNA interactions directly from motifs derived from triplex sequencing data. We find that there are several stable interaction codes, including Hoogsteen base pairing and novel RNA-DNA base pairings, which agree with in vitro measurements. We implemented these findings in TriplexAligner, a program that uses the determined interaction codes to predict triplex binding. TriplexAligner predicts RNA-DNA interactions identified in all-to-all sequencing data more accurately than all previously published tools in human and mouse and also predicts previously studied triplex interactions with known regulatory functions. We further validated a novel triplex interaction using biophysical experiments. Our work is an important step towards better understanding of triplex formation and allows genome-wide analyses of RNA-DNA interactions.

Keywords: DNA; RNA; RNA–DNA interaction; Triplex; machine learning.


Figures

Figure 1
Figure 1
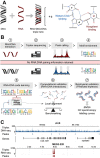
Overview of RNAformula imageDNA:DNA triple helix formation and the development of TriplexAligner from triplex-seq data. (A) Schematic of RNAformula imageDNA:DNA triple helix formation and effects on gene expression. (B) Overview of the development of TriplexAligner. (C) Peak calling on triplexDNA-seq (blue) and triplexRNA-seq data (red). The displayed regions reflect the published RNAformula imageDNA:DNA triple helix interaction between MEG3 and a DNA site in the locus of COL15A1, which results in the regulation of the downstream gene TGFBR1.
Figure 2
Figure 2
Identification of enriched and reproducible RNAformula imageDNA:DNA triple helix-forming motifs. (A) Distribution of triplexDNA-seq peaks across intronic regions (I), intergenic regions (IG), exonic regions (E) and promoter regions (p) as annotated in the hg38 genome build by NCBI. (B) Distribution of triplexRNA-seq peaks across antisense transcripts (AS), long non-coding RNAs (lnc), protein-coding transcripts (PC) and transcripts with retained introns (RI). (C) Total significantly enriched (formula image) triplexDNA and triplexRNA motifs identified per replicate of triplexDNA-seq and triplexRNA-seq. (D) Proportions of motifs per replicate with similar (formula image, Tomtom) motifs in accompanying replicates of triplexDNA-seq (blue) or triplexRNA-seq (red). (E) The five most enriched motifs across all replicates of triplexDNA-seq (left) and triplexRNA-seq (right). (F) Occurrence of triplexDNA motifs per kilobase of triplexDNA-seq peaks appearing in exonic (E), promoter (P), intergenic (IG) and intronic (I) genomic regions. (G) Occurence of triplexRNA motifs per kilobase of protein-coding (PC), retained intron (RI), long non-coding (lnc) and antisense (AS) transcripts. (H) Schematic of motif processing steps, including removal of identical motifs, removal of known protein-binding motifs and inclusion of reverse-complement triplexDNA motifs, which resulted in the final sets of triplexRNA (red) and triplexDNA (blue) motifs.
Figure 3
Figure 3
Learning RNAformula imageDNA:DNA triple helix nucleotide pairing rules from motifs using expectation-maximization. (A) Schematic of the expectation-maximization algorithm used to learn RNAformula imageDNA:DNA triple helix base pairing probabilities from pairings of enriched triplexRNA and triplexDNA motifs. (B) Example use-case of the expectation-maximization algorithm on simulated sets of motifs (formula image) which were paired by Watson–Crick base pairing rules, with corresponding objective values and number of incorrect motif pairs displayed per iteration of the algorithm. (C) Output from the expectation-maximization algorithm when run on enriched triplexDNA and triplexRNA motifs identified from triplex-seq, displaying the mean objective values across all code models learned per initiation of the algorithm and the corresponding proportion of motifs included. (D) Correlation between code model objective values and in vitro RNAformula imageDNA:DNA binding affinities as reported in [43]. Objective values and affinities were subjected to linear regression, with corresponding coefficient of determination (formula image) and formula image-value displayed on the plot. (E) Comparison in code model affinities between high-scoring subset (formula image, formula image) expectation-maximization results and a size-matched set of randomly generated code models (formula image, Wilcoxon signed-rank test). (F) High-scoring expectation-maximization results subjected to hierarchical clustering and tree-cutting (formula image), with corresponding clusters, code model affinities, objective values and total motifs assigned displayed. (G) Mean probabilistic code models per cluster of expectation-maximization results.
Figure 4
Figure 4
Computational validation of TriplexAligner using RNA–DNA interaction data and published RNAformula imageDNA:DNA triple helix interactions. (A) Schematic outlining the computational validation of TriplexAligner, using global RNA–DNA interactions identified by either RADICL-seq or RedC and subjecting the corresponding RNA and DNA sequences to prediction of RNAformula imageDNA:DNA triplex formation with TriplexAligner, Triplexator and LongTarget. Negative interaction data were generated by shuffling of RNA sequences. (B) ROC curves summarizing performance of TriplexAligner (orange), Triplexator (blue) and LongTarget (grey) in prediction of RADICL-seq RNA–DNA interactions. (C) ROC curves summarizing performance of TriplexAligner (orange), Triplexator (blue) and LongTarget (grey) in prediction of RedC RNA–DNA interactions. (D) Comparison of area under the ROC curves displayed in B and C (Non-sign. formula image, * formula image, *** formula image, bootstrapping (formula image)). (E) Area under the ROC curves of individual TriplexAligner code models for RADICL-seq and RedC RNA–DNA interactions. (F)TriplexAligner ROC curves for cis (RNA gene locus and interaction site on the same chromosome, solid line) and trans (RNA gene locus and interaction site on different chromosomes, dashed line) RNA–DNA interactions arising from RADICL-seq (purple) and RedC (orange) data. (G)TriplexAligner -log10(E) values for predicted interactions between lncRNA SARRAH and published interacting promoters ITPR2, PARP8, PDE3A, SSBP2 and GPC6, in comparison to the negative control promoter of GAPDH. (H)TriplexAligner predictions of published RNAformula imageDNA:DNA triplex helix formation between the lncRNAs NEAT1 and HOTAIR and the promoter regions of CYP4F22 and PCDH7, respectively. (I) Schematic of the lncRNA Neat1 showing most commonly predicted sites of RNAformula imageDNA:DNA triple helix formation in the lncRNA against multiple gene promoters dysregulated after Neat1 knockout.
Figure 5
Figure 5
Biophysical validation of interacting DNA and RNA sequences as predicted by TriplexAligner. (A) Maximal scoring DNA (blue) and RNA (red) subsequences across RADICL-seq interactions as predicted by TriplexAligner, which were synthesized in vitro and used in subsequent biophysical experiments investigating RNAformula imageDNA:DNA triple helix formation. (B) EMSA using combinations of DNA and RNA (shown in A), as either double-stranded DNA (dsDNA), double-stranded DNA and single-stranded RNA (dsDNA + ssRNA) and single-stranded DNA in combination with single-stranded RNA (heteroduplex). RNAformula imageDNA:DNA triple helix formation was investigated in RNase-free conditions (- RNase), in combination with RNaseH or in combination with RNaseA. (C) CD spectroscopy of double-stranded DNA and single-stranded RNA (Triplex, black), double-stranded DNA (dsDNA, blue) and single-stranded DNA with single-stranded RNA (Heteroduplex, red). (D) Melting analysis DNA and RNA molecules (described in C), with melting points labelled and annotated.

Similar articles

Cited by

References

    1. Holoch D, Moazed D. RNA-mediated epigenetic regulation of gene expression. Nat Rev Genet 2015; 16(2): 71–84. - PMC - PubMed
    1. Oo JA, Brandes RP, Leisegang MS. Long non-coding RNAs: novel regulators of cellular physiology and function. Pflügers Archiv-European Journal of Physiology 2021;1–14. - PMC - PubMed
    1. Takemata N, Ohta K. Role of non-coding RNA transcription around gene regulatory elements in transcription factor recruitment. RNA Biol 2017; 14(1): 1–5. - PMC - PubMed
    1. Andric V, Nevers A, Hazra D, et al.. A scaffold lncRNA shapes the mitosis to meiosis switch. Nat Commun 2021; 12(1): 1–12. - PMC - PubMed
    1. Shimada Y, Mohn F, Bühler M. The RNA-induced transcriptional silencing complex targets chromatin exclusively via interacting with nascent transcripts. Genes Dev 2016; 30(23): 2571–80. - PMC - PubMed

Publication types