A newly identified pyroptosis-related gene signature for predicting prognosis of patients with hepatocellular cancer
- PMID: 36237236
- PMCID: PMC9552084
- DOI: 10.21037/tcr-22-366
A newly identified pyroptosis-related gene signature for predicting prognosis of patients with hepatocellular cancer
Abstract
Background: Hepatocellular carcinoma (HCC) is a very heterogeneous illness, making prognosis prediction a huge problem. Pyroptosis, which has recently been shown to be an inflammatory type of programmed cell death, is involved in HCC. Nevertheless, the role of pyroptosis-related genes in HCC has not been fully elucidated. Thus, this study aimed to construct a prognostic signature based on pyroptosis-related genes for HCC.
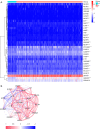
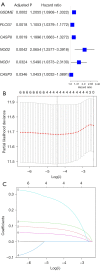
Methods: The messenger RNA expression patterns of HCC patients, as well as the accompanying clinical information, were retrieved from The Cancer Genome Atlas (TCGA) database for this research. After differentially expressed pyroptosis-related Gene in tumor and normal groups were identified, Cox regression analyses were performed to construct a prognostic signature which was then assessed through independent prognostic analysis.
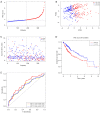
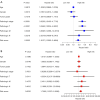
Results: A signature consisting of four genes (CASP8, GSDME, NOD2, and PLCG1) was constructed to predict overall survival (OS) for HCC. The signature was identified to be independent by the cox regression analysis and obtained the largest area under the receiver operating characteristic (ROC) curve (AUC) was 0.691, 0.628, and 0.632 for survival at 1, 2, and 3 years, respectively.
Conclusions: We discovered that the levels of pyroptosis-related genes expression differed across HCC patients and were associated with both survival and prognosis. This suggested that targeting pyroptosis as a treatment strategy for HCC may be a viable option.
Keywords: Hepatocellular carcinoma (HCC); gene signature; overall survival (OS); pyroptosis.
2022 Translational Cancer Research. All rights reserved.
Conflict of interest statement
Conflicts of Interest: All authors have completed the ICMJE uniform disclosure form (available at https://tcr.amegroups.com/article/view/10.21037/tcr-22-366/coif). The authors have no conflicts of interest to declare.
Figures

Similar articles
-
Construction and validation of a pyroptosis-related gene signature in hepatocellular carcinoma based on RNA sequencing.Transl Cancer Res. 2022 Jun;11(6):1510-1522. doi: 10.21037/tcr-21-2898. Transl Cancer Res. 2022. PMID: 35836524 Free PMC article.
-
Prognostic signature for hepatocellular carcinoma based on 4 pyroptosis-related genes.BMC Med Genomics. 2022 Jul 28;15(1):166. doi: 10.1186/s12920-022-01322-9. BMC Med Genomics. 2022. PMID: 35902905 Free PMC article.
-
Identification of a Pyroptosis-Related Gene Signature for Predicting Overall Survival and Response to Immunotherapy in Hepatocellular Carcinoma.Front Genet. 2021 Dec 3;12:789296. doi: 10.3389/fgene.2021.789296. eCollection 2021. Front Genet. 2021. PMID: 34925465 Free PMC article.
-
The pyroptosis-related gene signature predicts prognosis and indicates immune activity in hepatocellular carcinoma.Mol Med. 2022 Feb 5;28(1):16. doi: 10.1186/s10020-022-00445-0. Mol Med. 2022. PMID: 35123387 Free PMC article.
-
Role of gasdermin family proteins in the occurrence and progression of hepatocellular carcinoma.Heliyon. 2022 Oct 10;8(10):e11035. doi: 10.1016/j.heliyon.2022.e11035. eCollection 2022 Oct. Heliyon. 2022. PMID: 36254294 Free PMC article. Review.
Cited by
-
Gasdermin E mediates pyroptosis in the progression of hepatocellular carcinoma: a double-edged sword.Gastroenterol Rep (Oxf). 2024 Nov 6;12:goae102. doi: 10.1093/gastro/goae102. eCollection 2024. Gastroenterol Rep (Oxf). 2024. PMID: 39526199 Free PMC article. Review.
References
LinkOut - more resources
Full Text Sources
Miscellaneous
