Review
. 2022 Sep 24;23(19):11244.
doi: 10.3390/ijms231911244.

Drosophila as a Model Organism to Study Basic Mechanisms of Longevity

Affiliations
Review

Drosophila as a Model Organism to Study Basic Mechanisms of Longevity

Anna A Ogienko et al. Int J Mol Sci. .

Abstract

The spatio-temporal regulation of gene expression determines the fate and function of various cells and tissues and, as a consequence, the correct development and functioning of complex organisms. Certain mechanisms of gene activity regulation provide adequate cell responses to changes in environmental factors. Aside from gene expression disorders that lead to various pathologies, alterations of expression of particular genes were shown to significantly decrease or increase the lifespan in a wide range of organisms from yeast to human. Drosophila fruit fly is an ideal model system to explore mechanisms of longevity and aging due to low cost, easy handling and maintenance, large number of progeny per adult, short life cycle and lifespan, relatively low number of paralogous genes, high evolutionary conservation of epigenetic mechanisms and signalling pathways, and availability of a wide range of tools to modulate gene expression in vivo. Here, we focus on the organization of the evolutionarily conserved signaling pathways whose components significantly influence the aging process and on the interconnections of these pathways with gene expression regulation.

Keywords: Drosophila; IIS; JNK; NF-κB; TOR; aging; gene expression regulation; longevity; signaling pathway.


Conflict of interest statement

The authors declare no conflict of interest.

Figures

Figure 1
Figure 1
Drosophila insulin/IGF-1 signaling (IIS) pathway, a simplified schematic representation. The inactive and active states of the pathway are shown on the left and right, respectively. The binding of the insulin-like peptides (Ilp1-7) to insulin-like receptor (InR) initiates a phosphorylation cascade that results in the regulation of metabolism. Chico and Lnk, insulin receptor substrates; PI3K, phosphatidylinositol 3-kinase consisting of two subunits, catalytic Pi3K92E (Dp110) and regulatory Pi3K21B (Dp60); PIP2, phosphatidylinositol 4,5-bisphosphate; PIP3, phosphatidylinositol 3,4,5-trisphosphate; Pten, phosphatase and tensin homolog; Pdk1, 3-phosphoinositide dependent protein kinase-1; Akt, protein kinase B (PKB); Foxo, transcription factor Forkhead box O; 14-3-3, chaperone proteins. Arrows and bar-headed lines indicate activation and inhibition, respectively. Phosphate groups are depicted as solid black dots. Protein complexes are encircled by dashed lines. Inactive components of the pathway are shown in semi-transparent mode. Effects of mutations, depletion or overexpression of protein molecules on adult fly lifespan are color-coded according to the legend at the bottom; different simultaneous effects are shown as color gradients (for the references, see Supplementary Table S1).
Figure 2
Figure 2
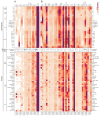
Heat map representation of the expression patterns of genes encoding components of Drosophila insulin/IGF-1 signaling (IIS) (A) and target of rapamycin (TOR) signaling (B) pathways during developmental stages (at the top) and across different tissues/organs (at the bottom). Gene expression data were taken from modENCODE and FlyAtlas 2 databases [64,65]. White and deep violet colors represent low and high gene expression levels, respectively. In addition, a summary of effects on fly lifespan caused by gene mutations, ubiquitous or tissue-specific knockdown or overexpression is shown between the gene expression top and bottom heat maps. Up and down arrows indicate increased and decreased adult fly lifespan, respectively; the size of arrows reflects the magnitude of the effect (for the references, see Supplementary Tables S1 and S2).
Figure 3
Figure 3
Drosophila target of rapamycin (TOR) signaling pathway, a simplified schematic representation. The inactive and active states of the pathway are shown on the left and right, respectively. The anabolic kinase TOR functions in two distinct complexes, TORC1 and TORC2, and regulates cap-dependent translation as well as chromatin architecture and gene regulation. Through a number of intermediate steps, nutrients, particularly amino acids, and growth factors, such as insulin-like peptides, activate TORC1 (for additional details, see Figure 1). Akt, protein kinase B (PKB); Alc, Alicorn; AMPK, AMP-activated protein kinase; Chrb, Charybde; Fkbp12, FK506-binding protein 12kD; GATOR, GAP activity towards the Rags; Gig, Gigas; HP1, heterochromatin protein 1; Iml1, Increased minichromosome loss 1; Lkb1, Lkb1 kinase; Mts, Microtubule star; Nclb, No child left behind; Nprl2, Nitrogen permease regulator-like 2; Nprl3, Nitrogen permease regulator-like 3; Pp2A-29B, Protein phosphatase 2A at 29B; RagA-B, Ras-related GTP binding A/B; RagC-D, Ras-related GTP binding C/D; REPTOR, Repressed by TOR; REPTOR-BP, REPTOR-binding partner; Rheb, Ras homolog enriched in brain; Rictor, Rapamycin-insensitive companion of Tor; Scyl, Scylla; Sesn, a stress-inducible protein Sestrin; Sin1, SAPK-interacting protein 1; Slif, Slimfast; SNF4Aγ, SNF4/AMP-activated protein kinase gamma subunit; Tor, Target of rapamycin; V-ATPase, vacuolar-type ATPase; Wdb, Widerborst; 14-3-3, chaperone proteins. For the other proteins shown in the scheme, the symbols and the full names are identical. Arrows and bar-headed lines indicate activation and inhibition, respectively. Dotted arrows indicate that the molecular mechanisms are not fully understood. Phosphate groups are depicted as solid black dots. Protein complexes are encircled by dashed lines. Inactive components of the pathway are shown in semi-transparent mode. It should be noted that the indicated transcription factors might not always be required together for the activity of the target genes. Effects of mutations, depletion or overexpression of protein molecules on adult fly lifespan are color-coded according to the legend at the bottom; different simultaneous effects are shown as color gradients (for the references, see Supplementary Table S2).
Figure 4
Figure 4
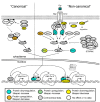
Drosophila NF-κB pathway, a simplified schematic representation. The Imd and Toll pathways are shown on the left and right, respectively. Upon infection with Gram-negative bacteria, the Imd pathway is activated through direct recognition of Gram-negative bacterial PGN by PGRP-LC at the cell surface. This creates a transient signaling platform resulting also in the transcription activation of genes encoding AMPs. 1, 2, and 3 indicate successive stages of the Imd pathway activation. In response to both Gram-positive cocci and fungi, Spz (Spatzle) is processed into a biologically active ligand and binds to the Toll receptor. This interaction initiates a proteolytic cascade that results in the transcription activation of genes encoding AMPs. AP-1, activator protein 1 transcription factor; Ben, Bendless (E2 ubiquitin-conjugating enzyme, an Ubc13 homolog); Cact, Cactus; Cad, Caudal; Diap2, Diap protein 2; Dif, transcription factor Dorsal-related immunity factor; Dl, transcription factor Dorsal; Dredd, Death related ced-3/Nedd2-like caspase (also known as Dcp2); Eff, Effete (E2 ubiquitin-conjugating enzyme, an Ubc5 homolog); Fadd, Fas-associated death domain; Gcn5, Gcn5 acetyltransferase (PCAF); IKK, IκB kinase complex; IKKβ, IκB kinase; Imd, Immune deficiency; JNK, c-Jun N-terminal kinase; Key, Kenny; Myd88, adaptor protein Myd88; Nub, Nubbin; Pirk, Poor Imd response upon knock-in; Pli, Pellino (a RING-domain-containing ubiquitin E3 ligase); Pll, Pelle, the serine/threonine kinase ortholog of IRAK; PGN, peptidoglycan; PGRP-LC, Peptidoglycan recognition protein LC; PGRP-LE, Peptidoglycan recognition protein LE; Rel, Relish; Tab2, Tak1-associated binding protein 2; Tak1, (TGF-β)-activating kinase 1; Tg, Transglutaminase; Trbd, Trabid; Tub, adaptor protein Tube; Uev1A, Ubiquitin-conjugating enzyme variant 1A (Ubc/E2 variant (Uev) homolog); Zfh1, Zn finger homeodomain 1. For the other proteins shown in the scheme, the symbols and the full names are identical. Arrows and bar-headed lines indicate activation and inhibition, respectively. Phosphate groups are depicted as solid black dots. Ubiquitin chains are shown as a string of white circles. Protein complexes are encircled by dashed lines. Inactive components of the pathway are shown in semi-transparent mode. Effects of mutations, depletion or overexpression of protein molecules on adult fly lifespan are color-coded according to the legend at the bottom; different simultaneous effects are shown as color gradients (for the references, see Supplementary Table S3).
Figure 5
Figure 5
Heat map representation of the expression patterns of genes encoding components of Drosophila NF-κB (A) and JNK signaling (B) pathways during developmental stages (at the top) and across different tissues/organs (at the bottom). Gene expression data were taken from modENCODE and FlyAtlas 2 databases [64,65]. White and deep violet colors represent low and high gene expression levels, respectively. In addition, a summary of effects on fly lifespan caused by gene mutations, ubiquitous or tissue-specific knockdown or overexpression is shown between the gene expression top and bottom heat maps. Up and down arrows indicate increased and decreased adult fly lifespan, respectively; the size of arrows reflects the magnitude of the effect (for the references, see Supplementary Tables S3 and S4).
Figure 6
Figure 6
The JNK pathway in Drosophila, a simplified schematic representation. Stress-induced JNK pathway is activated through Egr interaction with receptors Wgn or Grnd. This interaction initiates the hierarchical phosphorylation and subsequent activation of the MAPK cascade. AP-1, activator protein 1 transcription factor; Ask1, Apoptotic signal-regulating kinase 1; Bsk, Basket; Btk, Bruton tyrosine kinase; Ccm3, Cerebral cavernous malformation 3; Cka, Connector of kinase to AP-1; CYLD, Cylindromatosis; Dok, Downstream of kinase; Egr, Eiger; Fgop2, Fibroblast growth factor receptor 1 oncogene partner 2; Foxo, Forkhead box, sub-group O; Grnd, Grindelwald; Hep, Hemipterous; Jra, Jun-related antigen; Kay, Kayak; Mkk4, MAP kinase kinase 4; Mob4, MOB kinase activator 4; Msn, Misshapen; Naus, Nausicaa; Pp2A-29B, Protein phosphatase 2A at 29B; Prx2, Peroxiredoxin 2; Puc, Puckered; Shark, SH2 domain ankyrin repeat kinase; Slmap, Sarcolemma associated protein; Slpr, Slipper; Src42A, Src oncogene at 42A; Src64B, Src oncogene at 64B; Stat92E, Signal-transducer and activator of transcription protein at 92E; STRIPAK, Striatin-interacting phosphatase and kinase complex; Strip, Striatin interacting protein; Tab2, Tak1-associated binding protein 2; Tak1, TGF-β activated kinase 1; Traf4, TNF-receptor-associated factor 4; Traf6, TNF-receptor-associated factor 6; Wgn, Wengen; Wnd, Wallenda. Arrows and bar-headed lines indicate activation and inhibition, respectively. Phosphate groups are depicted as solid black dots. Ubiquitin chain is shown as a string of white circles. Protein complexes are encircled by dashed lines. Effects of mutations, depletion or overexpression of protein molecules on adult fly lifespan are color-coded according to the legend at the bottom; different simultaneous effects are shown as color gradients (for the references, see Supplementary Table S4).

Similar articles

Cited by

References

    1. Kennedy B.K., Berger S.L., Brunet A., Campisi J., Cuervo A.M., Epel E.S., Franceschi C., Lithgow G.J., Morimoto R.I., Pessin J.E., et al. Geroscience: Linking aging to chronic disease. Cell. 2014;159:709–713. doi: 10.1016/j.cell.2014.10.039. - DOI - PMC - PubMed
    1. Gan T., Fan L., Zhao L., Misra M., Liu M., Zhang M., Su Y. JNK Signaling in Drosophila Aging and Longevity. Int. J. Mol. Sci. 2021;22:9649. doi: 10.3390/ijms22179649. - DOI - PMC - PubMed
    1. Green C.L., Lamming D.W., Fontana L. Molecular mechanisms of dietary restriction promoting health and longevity. Nat. Rev. Mol. Cell Biol. 2022;23:56–73. doi: 10.1038/s41580-021-00411-4. - DOI - PMC - PubMed
    1. Miller H.A., Dean E.S., Pletcher S.D., Leiser S.F. Cell non-autonomous regulation of health and longevity. Elife. 2020;9:e62659. doi: 10.7554/eLife.62659. - DOI - PMC - PubMed
    1. Green M.M. 2010: A century of Drosophila genetics through the prism of the white gene. Genetics. 2010;184:3–7. doi: 10.1534/genetics.109.110015. - DOI - PMC - PubMed

LinkOut - more resources