

Hypoxia-Inducible Expression of Annexin A6 Enhances the Resistance of Triple-Negative Breast Cancer Cells to EGFR and AR Antagonists
- PMID: 36230969
- PMCID: PMC9564279
- DOI: 10.3390/cells11193007
Hypoxia-Inducible Expression of Annexin A6 Enhances the Resistance of Triple-Negative Breast Cancer Cells to EGFR and AR Antagonists
Abstract
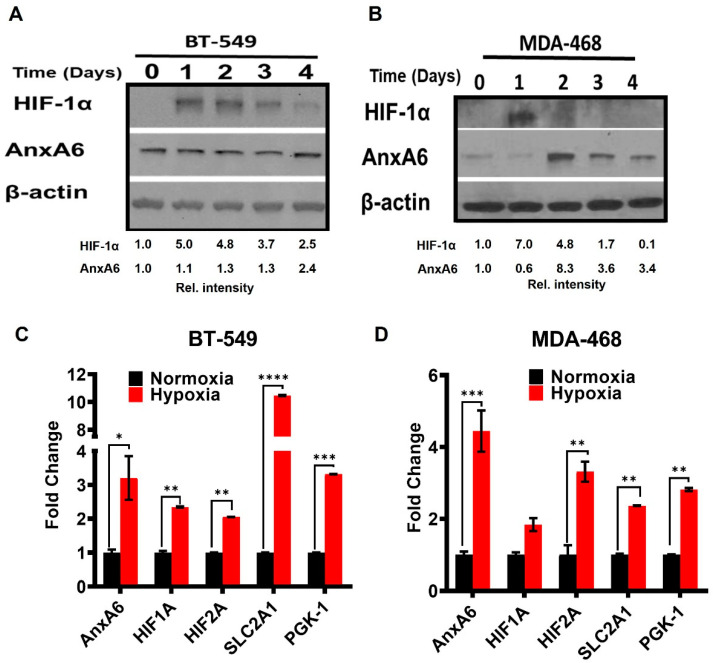
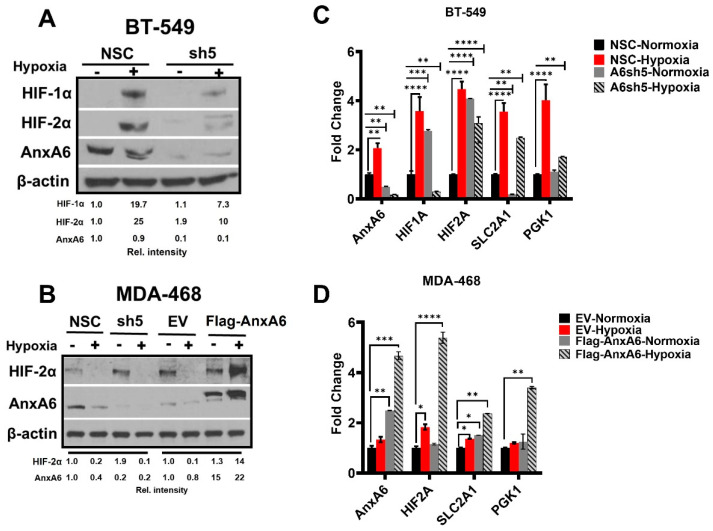
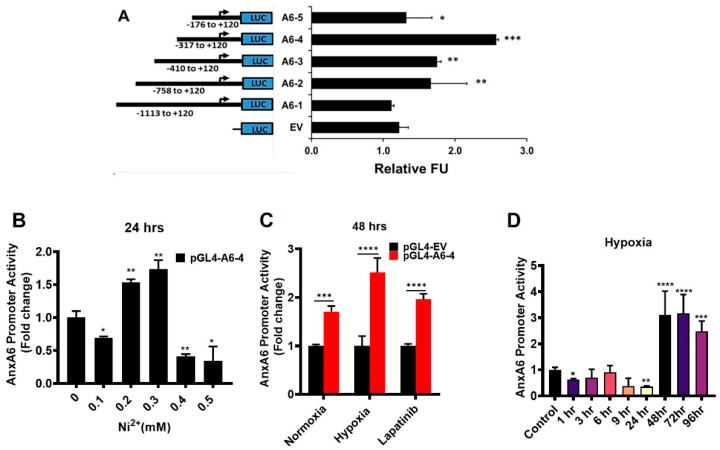
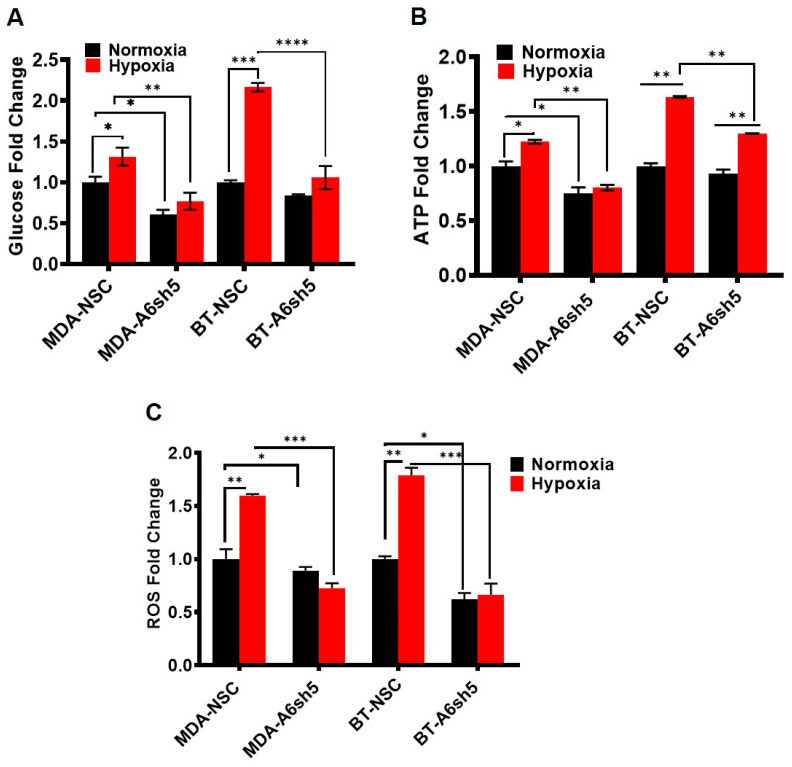
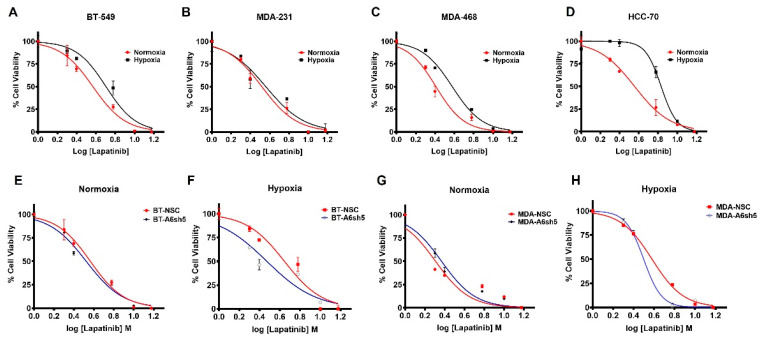
Physiological changes such as hypoxia in the tumor microenvironment (TME) endow cancer cells with malignant properties, leading to tumor recurrence and rapid progression. Here, we assessed the effect of hypoxia (1% Oxygen) on the tumor suppressor Annexin A6 (AnxA6) and the response of triple-negative breast cancer (TNBC) cells to epidermal growth factor receptor (EGFR) and androgen receptor (AR) targeted therapies. We demonstrate that brief exposure of TNBC cells to hypoxia (within 24 h) is associated with down regulation of AnxA6 while > 24 h exposure cell type dependently stimulated the expression of AnxA6. Hypoxia depicted by the expression and stability of HIF-1/2α led to up regulation of the HIF target genes SLC2A1, PGK1 as well as AR and the AR target genes FABP-4 and PPAR-γ, but the cellular levels of AnxA6 protein decreased under prolonged hypoxia. Down regulation of AnxA6 in TNBC cells inhibited, while AnxA6 over expression enhanced the expression and cellular levels of HIF-1/2α, SLC2A1 and PGK1. RNAi mediated inhibition of hypoxia induced AnxA6 expression also strongly inhibited glucose uptake and ROS production in AnxA6 expressing TNBC cells. Using a luciferase reporter assay, we confirm that short-term exposure of cells to hypoxia inhibits while prolonged exposure of cells to hypoxia enhances AnxA6 promoter activity in HEK293T cells. Compared to cells cultured under normoxia, TNBC cells were more resistant to lapatinib under hypoxic conditions, and the downregulation of AnxA6 sensitized the cells to EGFR as well as AR antagonists. These data suggest that AnxA6 is a hypoxia inducible gene and that targeting AnxA6 upregulation may be beneficial in overcoming TNBC resistance to EGFR and/or AR targeted therapies.
Keywords: EGFR; Lapatinib; androgen receptor; annexin A6; hypoxia; therapy resistance; triple-negative breast cancer.
Conflict of interest statement
The authors declare no conflict of interest.
Figures

Similar articles
-
Exosomal annexin A6 induces gemcitabine resistance by inhibiting ubiquitination and degradation of EGFR in triple-negative breast cancer.Cell Death Dis. 2021 Jul 8;12(7):684. doi: 10.1038/s41419-021-03963-7. Cell Death Dis. 2021. PMID: 34238922 Free PMC article.
-
Lapatinib-induced annexin A6 upregulation as an adaptive response of triple-negative breast cancer cells to EGFR tyrosine kinase inhibitors.Carcinogenesis. 2019 Aug 22;40(8):998-1009. doi: 10.1093/carcin/bgy192. Carcinogenesis. 2019. PMID: 30590459 Free PMC article.
-
Reduced annexin A6 expression promotes the degradation of activated epidermal growth factor receptor and sensitizes invasive breast cancer cells to EGFR-targeted tyrosine kinase inhibitors.Mol Cancer. 2013 Dec 19;12(1):167. doi: 10.1186/1476-4598-12-167. Mol Cancer. 2013. PMID: 24354805 Free PMC article.
-
Diverse Roles of Annexin A6 in Triple-Negative Breast Cancer Diagnosis, Prognosis and EGFR-Targeted Therapies.Cells. 2020 Aug 7;9(8):1855. doi: 10.3390/cells9081855. Cells. 2020. PMID: 32784650 Free PMC article. Review.
-
Adaptation to Hypoxia May Promote Therapeutic Resistance to Androgen Receptor Inhibition in Triple-Negative Breast Cancer.Int J Mol Sci. 2022 Aug 9;23(16):8844. doi: 10.3390/ijms23168844. Int J Mol Sci. 2022. PMID: 36012111 Free PMC article. Review.
Cited by
-
Clinical effectiveness and safety of gemcitabine plus capecitabine in the treatment of advanced triple-negative breast cancer.Am J Transl Res. 2024 May 15;16(5):1945-1952. doi: 10.62347/QOWN3646. eCollection 2024. Am J Transl Res. 2024. PMID: 38883354 Free PMC article.
-
ANXA6: a key molecular player in cancer progression and drug resistance.Discov Oncol. 2023 May 2;14(1):53. doi: 10.1007/s12672-023-00662-x. Discov Oncol. 2023. PMID: 37129645 Free PMC article. Review.
-
Activating UCHL1 through the CRISPR activation system promotes cartilage differentiation mediated by HIF-1α/SOX9.J Cell Mol Med. 2024 Sep;28(17):e70051. doi: 10.1111/jcmm.70051. J Cell Mol Med. 2024. PMID: 39223923 Free PMC article.
-
Bibliometric analysis of phosphoglycerate kinase 1 expression in breast cancer and its distinct upregulation in triple-negative breast cancer.World J Clin Oncol. 2024 Jul 24;15(7):867-894. doi: 10.5306/wjco.v15.i7.867. World J Clin Oncol. 2024. PMID: 39071464 Free PMC article.
References
-
- Vaupel P., Mayer A., Briest S., Hockel M. Hypoxia in breast cancer: Role of blood flow, oxygen diffusion distances, and anemia in the development of oxygen depletion. Adv. Exp. Med. Biol. 2005;566:333–342. - PubMed
Publication types
MeSH terms
Substances
Grants and funding
LinkOut - more resources
Full Text Sources
Research Materials
Miscellaneous
