

Comprehensive analysis for cellular senescence-related immunogenic characteristics and immunotherapy prediction of acute myeloid leukemia
- PMID: 36225590
- PMCID: PMC9548549
- DOI: 10.3389/fphar.2022.987398
Comprehensive analysis for cellular senescence-related immunogenic characteristics and immunotherapy prediction of acute myeloid leukemia
Abstract
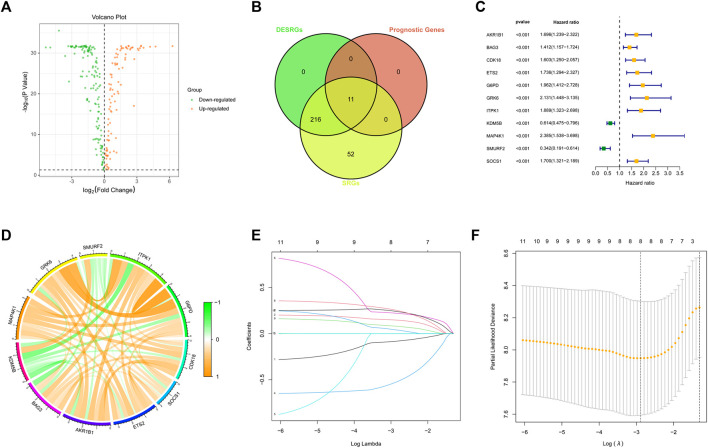
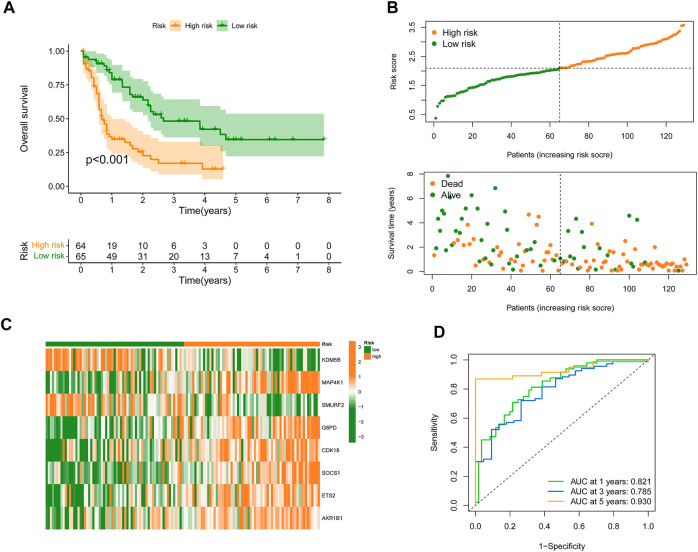
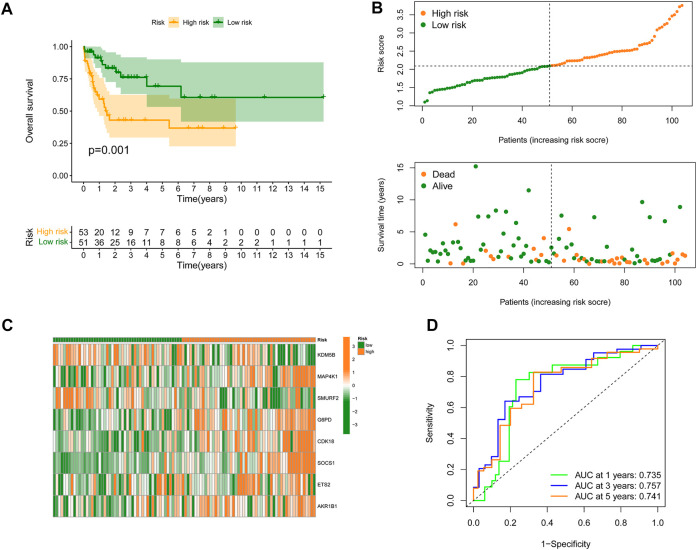
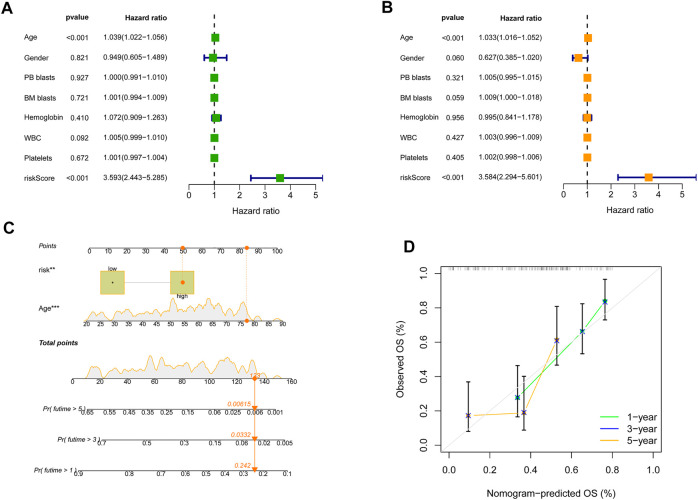
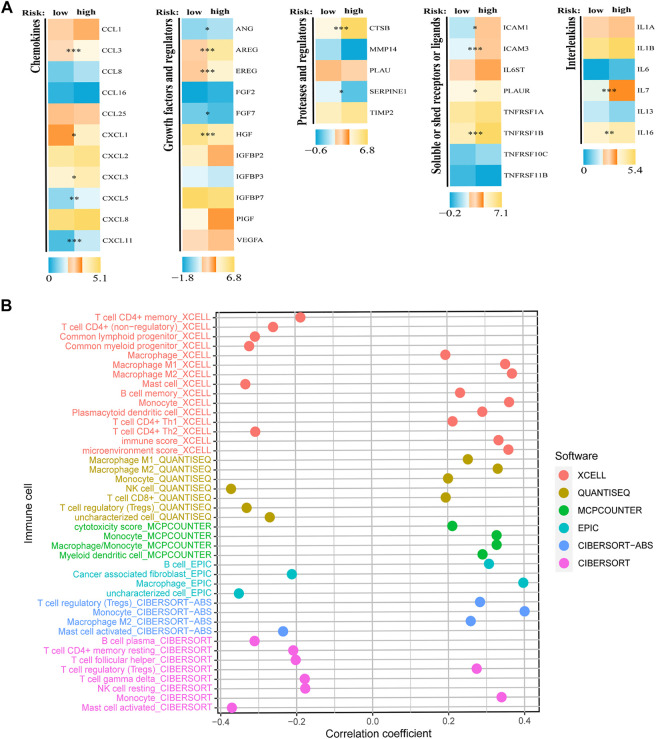
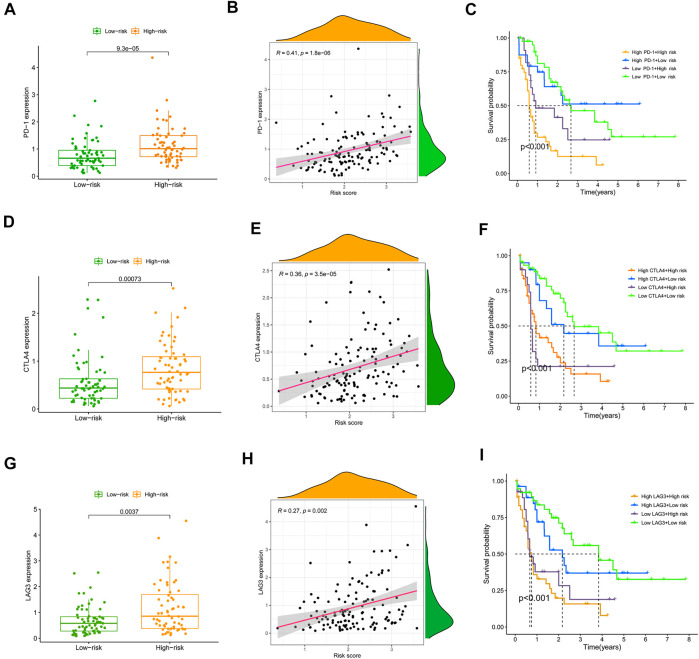
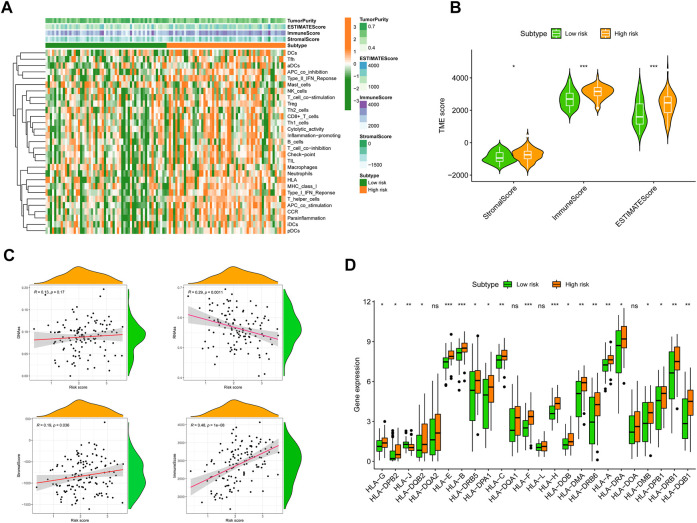
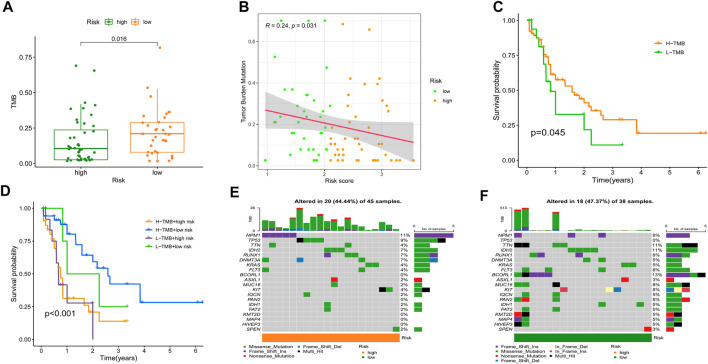
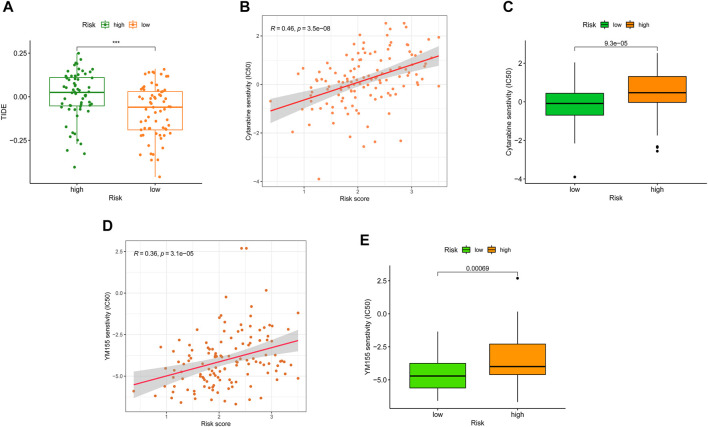
In malignancies, cellular senescence is critical for carcinogenesis, development, and immunological regulation. Patients with acute myeloid leukemia (AML) have not investigated a reliable cellular senescence-associated profile and its significance in outcomes and therapeutic response. Cellular senescence-related genes were acquired from the CellAge database, while AML data were obtained from the GEO and TCGA databases. The TCGA-AML group served as a training set to construct a prognostic risk score signature, while the GSE71014 set was used as a testing set to validate the accuracy of the signature. Through exploring the expression profiles of cellular senescence-related genes (SRGs) in AML patients, we used Lasso and Cox regression analysis to establish the SRG-based signature (SRGS), which was validated as an independent prognostic predictor for AML patients via clinical correlation. Survival analysis showed that AML patients in the low-risk score group had a longer survival time. Tumor immune infiltration and functional enrichment analysis demonstrated that AML patients with low-risk scores had higher immune infiltration and active immune-related pathways. Meanwhile, drug sensitivity analysis and the TIDE algorithm showed that the low-risk score group was more susceptible to chemotherapy and immunotherapy. Cell line analysis in vitro further confirmed that the SRGs in the proposed signature played roles in the susceptibility to cytarabine and YM155. Our results indicated that SRGS, which regulates the immunological microenvironment, is a reliable predictor of the clinical outcome and immunotherapeutic response in AML.
Keywords: acute myeloid leukemia; cellular senescence; immunotherapy; senescence-associated secretory phenotype; tumor microenvironment; tumor mutation burden.
Copyright © 2022 Mao, Xu, Xu, Qiu, Hu, Jiang and Zhou.
Conflict of interest statement
The authors declare that the research was conducted in the absence of any commercial or financial relationships that could be construed as a potential conflict of interest.
Figures
Similar articles
-
Identification of a novel senescence-associated signature to predict biochemical recurrence and immune microenvironment for prostate cancer.Front Immunol. 2023 Feb 20;14:1126902. doi: 10.3389/fimmu.2023.1126902. eCollection 2023. Front Immunol. 2023. PMID: 36891298 Free PMC article.
-
Identification of cellular senescence-related signature for predicting prognosis and therapeutic response of acute myeloid leukemia.Aging (Albany NY). 2023 Oct 13;15(20):11217-11226. doi: 10.18632/aging.205123. Epub 2023 Oct 13. Aging (Albany NY). 2023. PMID: 37845004 Free PMC article.
-
Cellular Senescence-Related Genes: Predicting Prognosis in Gastric Cancer.Front Genet. 2022 Jun 1;13:909546. doi: 10.3389/fgene.2022.909546. eCollection 2022. Front Genet. 2022. PMID: 35719376 Free PMC article.
-
A Four-Cell-Senescence-Regulator-Gene Prognostic Index Verified by Genome-Wide CRISPR Can Depict the Tumor Microenvironment and Guide Clinical Treatment of Bladder Cancer.Front Immunol. 2022 Jul 11;13:908068. doi: 10.3389/fimmu.2022.908068. eCollection 2022. Front Immunol. 2022. PMID: 35898492 Free PMC article.
-
Identification and validation of a novel cellular senescence-related lncRNA prognostic signature for predicting immunotherapy response in stomach adenocarcinoma.Front Genet. 2022 Aug 25;13:935056. doi: 10.3389/fgene.2022.935056. eCollection 2022. Front Genet. 2022. PMID: 36092903 Free PMC article.
Cited by
-
Machine Learning-Based Integrated Analysis of PANoptosis Patterns in Acute Myeloid Leukemia Reveals a Signature Predicting Survival and Immunotherapy.Int J Clin Pract. 2024 Jan 30;2024:5113990. doi: 10.1155/2024/5113990. eCollection 2024. Int J Clin Pract. 2024. PMID: 38322112 Free PMC article.
-
Data-driven modeling of core gene regulatory network underlying leukemogenesis in IDH mutant AML.NPJ Syst Biol Appl. 2024 Apr 9;10(1):38. doi: 10.1038/s41540-024-00366-0. NPJ Syst Biol Appl. 2024. PMID: 38594351 Free PMC article.
-
Establishment and validation of a gene mutation-based risk model for predicting prognosis and therapy response in acute myeloid leukemia.Heliyon. 2024 May 15;10(10):e31249. doi: 10.1016/j.heliyon.2024.e31249. eCollection 2024 May 30. Heliyon. 2024. PMID: 38831838 Free PMC article.
-
Differentially Expressed Genes and Molecular Susceptibility to Human Age-Related Diseases.Int J Mol Sci. 2023 Feb 16;24(4):3996. doi: 10.3390/ijms24043996. Int J Mol Sci. 2023. PMID: 36835409 Free PMC article.
-
A View of Myeloid Transformation through the Hallmarks of Cancer.Blood Cancer Discov. 2024 Nov 1;5(6):377-387. doi: 10.1158/2643-3230.BCD-24-0009. Blood Cancer Discov. 2024. PMID: 39422551 Review.
References
LinkOut - more resources
Full Text Sources