Exploration of hub genes involved in PCOS using biological informatics methods
- PMID: 36221354
- PMCID: PMC9542654
- DOI: 10.1097/MD.0000000000030905
Exploration of hub genes involved in PCOS using biological informatics methods
Abstract
Background: The aim of this study was to find underlying genes and their interaction mechanism crucial to the polycystic ovarian syndrome (PCOS) by analyzing differentially expressed genes (DEGs) between PCOS and non-PCOS subjects.
Methods: Gene expression data of PCOS and non-PCOS subjects were collected from gene expression omnibus (GEO) database. GEO2R were used to calculating P value and logFC. The screening threshold of DEGs was P < .05 and | FC | ≥ 1.2. GO annotation and Kyoto encyclopedia of genes and genomes (KEGG) signaling pathway enrichment analysis was performed by using DAVID (2021 Update). The protein-protein interaction (PPI) network of DEGs was constructed by using the STRING database, and the hub genes were recognized through Hubba plugin of Cytoscape software.
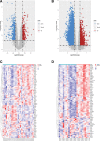
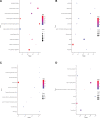
Results: PCOS and non-PCOS subjects shared a total of 174 DGEs, including 14 upregulated and 160 downregulated genes. The GO biological processes enriched by DEGs mainly involved actin cytoskeleton organization, positive regulation of NF-κB signaling pathway, and positive regulation of canonical Wnt signaling pathway. The DEGs were significantly enriched in cytoplasm, nucleus and cytosol. Their molecular functions mainly focused on protein binding, calmodulin binding and glycerol-3-phosphate dehydrogenase activity. The PI3K/Akt signaling pathway and glycosaminoglycan biosynthesis were highlighted as critical pathways enriched by DEGs. 10 hub genes were screened from the constructed PPI network, of which EGF, FN1 and TLR4 were mainly enriched in the PI3K/Akt signaling pathway.
Conclusion: In this study, a total of 174 DEGs and 10 hub genes were identified as new candidate targets for insulin resistance (IR) in PCOS individuals, which may provide a new direction for developing novel treatment strategies for PCOS.
Copyright © 2022 the Author(s). Published by Wolters Kluwer Health, Inc.
Conflict of interest statement
The authors have no funding and conflicts of interest to disclose.
Figures


Similar articles
-
Network exploration of gene signatures underlying low birth weight induced metabolic alterations.Medicine (Baltimore). 2022 Oct 28;101(43):e31489. doi: 10.1097/MD.0000000000031489. Medicine (Baltimore). 2022. PMID: 36316897 Free PMC article.
-
Identification of Hub Genes and Biomarkers between Hyperandrogen and Normoandrogen Polycystic Ovary Syndrome by Bioinformatics Analysis.Comb Chem High Throughput Screen. 2023;26(1):126-134. doi: 10.2174/1386207325666220404101009. Comb Chem High Throughput Screen. 2023. PMID: 35379124
-
Integrated bioinformatics analysis for the screening of hub genes and therapeutic drugs in ovarian cancer.J Ovarian Res. 2020 Jan 27;13(1):10. doi: 10.1186/s13048-020-0613-2. J Ovarian Res. 2020. PMID: 31987036 Free PMC article.
-
Identification of candidate biomarkers and pathways associated with SCLC by bioinformatics analysis.Mol Med Rep. 2018 Aug;18(2):1538-1550. doi: 10.3892/mmr.2018.9095. Epub 2018 May 29. Mol Med Rep. 2018. PMID: 29845250 Free PMC article.
-
Integrated Analysis of Hub Genes and Pathways In Esophageal Carcinoma Based on NCBI's Gene Expression Omnibus (GEO) Database: A Bioinformatics Analysis.Med Sci Monit. 2020 Aug 5;26:e923934. doi: 10.12659/MSM.923934. Med Sci Monit. 2020. PMID: 32756534 Free PMC article.
Cited by
-
Protein Expression and Bioinformatics Study of Granulosa Cells of Polycystic Ovary Syndrome Expressed Under the Influence of DHEA.Clin Med Insights Endocrinol Diabetes. 2023 Nov 14;16:11795514231206732. doi: 10.1177/11795514231206732. eCollection 2023. Clin Med Insights Endocrinol Diabetes. 2023. PMID: 38023736 Free PMC article.
-
Network pharmacology-based strategic prediction and target identification of apocarotenoids and carotenoids from standardized Kashmir saffron (Crocus sativus L.) extract against polycystic ovary syndrome.Medicine (Baltimore). 2023 Aug 11;102(32):e34514. doi: 10.1097/MD.0000000000034514. Medicine (Baltimore). 2023. PMID: 37565925 Free PMC article.
-
Hypermethylation and down-regulation of vitamin D receptor (VDR) as contributing factors for polycystic ovary syndrome (PCOS): a case-control study from Kashmir, North India.Arch Gynecol Obstet. 2024 Mar;309(3):1091-1100. doi: 10.1007/s00404-023-07326-9. Epub 2024 Jan 16. Arch Gynecol Obstet. 2024. PMID: 38227018
-
Predicting Unfavorable Pregnancy Outcomes in Polycystic Ovary Syndrome (PCOS) Patients Using Machine Learning Algorithms.Medicina (Kaunas). 2024 Aug 11;60(8):1298. doi: 10.3390/medicina60081298. Medicina (Kaunas). 2024. PMID: 39202579 Free PMC article.
References
-
- Rodgers RJ, Suturina L, Lizneva D, et al. . Is polycystic ovary syndrome a 20th Century phenomenon? Med Hypotheses. 2019;124:31–4. - PubMed
MeSH terms
Substances
LinkOut - more resources
Full Text Sources
Medical
Miscellaneous

