Targeting integrin α2 as potential strategy for radiochemosensitization of glioblastoma
- PMID: 36219689
- PMCID: PMC10076950
- DOI: 10.1093/neuonc/noac237
Targeting integrin α2 as potential strategy for radiochemosensitization of glioblastoma
Abstract
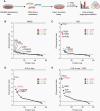
Background: Glioblastoma (GBM) is a fast-growing primary brain tumor characterized by high invasiveness and resistance. This results in poor patient survival. Resistance is caused by many factors, including cell-extracellular matrix (ECM) interactions. Here, we addressed the role of adhesion protein integrin α2, which we identified in a high-throughput screen for novel potential targets in GBM cells treated with standard therapy consisting of temozolomide (TMZ) and radiation.
Methods: In our study, we used a range of primary/stem-like and established GBM cell models in vitro and in vivo. To identify regulatory mechanisms, we employed high-throughput kinome profiling, Western blotting, immunofluorescence staining, reporter, and activity assays.
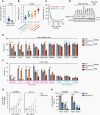
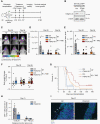
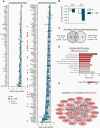
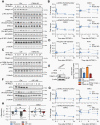
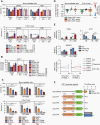
Results: Our data showed that integrin α2 is overexpressed in GBM compared to normal brain and, that its deletion causes radiochemosensitization. Similarly, invasion and adhesion were significantly reduced in TMZ-irradiated GBM cell models. Furthermore, we found that integrin α2-knockdown impairs the proliferation of GBM cells without affecting DNA damage repair. At the mechanistic level, we found that integrin α2 affects the activity of activating transcription factor 1 (ATF1) and modulates the expression of extracellular signal-regulated kinase 1 (ERK1) regulated by extracellular signals. Finally, we demonstrated that integrin α2-deficiency inhibits tumor growth and thereby prolongs the survival of mice with orthotopically growing GBM xenografts.
Conclusions: Taken together our data suggest that integrin α2 may be a promising target to overcome GBM resistance to radio- and chemotherapy. Thus, it would be worth evaluating how efficient and safe the adjuvant use of integrin α2 inhibitors is to standard radio(chemo)therapy in GBM.
Keywords: ATF1; ERK1; glioblastoma; integrin α2; radiochemoresistance.
© The Author(s) 2022. Published by Oxford University Press on behalf of the Society for Neuro-Oncology. All rights reserved. For permissions, please e-mail: journals.permissions@oup.com.
Conflict of interest statement
The authors declare no conflict of interest.
Figures

Similar articles
-
Combination therapy in a xenograft model of glioblastoma: enhancement of the antitumor activity of temozolomide by an MDM2 antagonist.J Neurosurg. 2017 Feb;126(2):446-459. doi: 10.3171/2016.1.JNS152513. Epub 2016 May 13. J Neurosurg. 2017. PMID: 27177180 Free PMC article.
-
TTK Protein Kinase promotes temozolomide resistance through inducing autophagy in glioblastoma.BMC Cancer. 2022 Jul 18;22(1):786. doi: 10.1186/s12885-022-09899-1. BMC Cancer. 2022. PMID: 35850753 Free PMC article.
-
Loss of programmed cell death 10 activates tumor cells and leads to temozolomide-resistance in glioblastoma.J Neurooncol. 2019 Jan;141(1):31-41. doi: 10.1007/s11060-018-03017-7. Epub 2018 Nov 3. J Neurooncol. 2019. PMID: 30392087
-
Involvement of Intracellular Cholesterol in Temozolomide-Induced Glioblastoma Cell Death.Neurol Med Chir (Tokyo). 2018 Jul 15;58(7):296-302. doi: 10.2176/nmc.ra.2018-0040. Epub 2018 Jun 13. Neurol Med Chir (Tokyo). 2018. PMID: 29899179 Free PMC article. Review.
-
Glioblastoma and the search for non-hypothesis driven combination therapeutics in academia.Front Oncol. 2023 Jan 17;12:1075559. doi: 10.3389/fonc.2022.1075559. eCollection 2022. Front Oncol. 2023. PMID: 36733367 Free PMC article. Review.
Cited by
-
Simultaneous inhibition of discoidin domain receptor 1 and integrin αVβ3 radiosensitizes human glioblastoma cells.Am J Cancer Res. 2023 Oct 15;13(10):4597-4612. eCollection 2023. Am J Cancer Res. 2023. PMID: 37970361 Free PMC article.
-
The Interplay between Extracellular Matrix Remodeling and Cancer Therapeutics.Cancer Discov. 2024 Aug 2;14(8):1375-1388. doi: 10.1158/2159-8290.CD-24-0002. Cancer Discov. 2024. PMID: 39091205 Free PMC article. Review.
-
Meta-analysis of expression and the targeting of cell adhesion associated genes in nine cancer types - A one research lab re-evaluation.Comput Struct Biotechnol J. 2023 Apr 19;21:2824-2836. doi: 10.1016/j.csbj.2023.04.017. eCollection 2023. Comput Struct Biotechnol J. 2023. PMID: 37206618 Free PMC article.
-
Integrins in cancer stem cells.Front Cell Dev Biol. 2024 Aug 21;12:1434378. doi: 10.3389/fcell.2024.1434378. eCollection 2024. Front Cell Dev Biol. 2024. PMID: 39239559 Free PMC article. Review.
-
Resistance of HNSCC cell models to pan-FGFR inhibition depends on the EMT phenotype associating with clinical outcome.Mol Cancer. 2024 Feb 21;23(1):39. doi: 10.1186/s12943-024-01954-8. Mol Cancer. 2024. PMID: 38378518 Free PMC article.
References
-
- Louis DN, Perry A, Reifenberger G, et al. . The 2016 world health organization classification of tumors of the central nervous system: a summary. Acta Neuropathol. 2016;131(6):803–820. - PubMed
-
- Becker KP, Yu J. Status quo-standard-of-care medical and radiation therapy for glioblastoma. Cancer J. 2012;18(1):12–19. - PubMed
-
- Stupp R, Mason WP, van den Bent MJ, et al. . Radiotherapy plus concomitant and adjuvant temozolomide for glioblastoma. N Engl J Med. 2005;352(10):987–996. - PubMed
Publication types
MeSH terms
Substances
LinkOut - more resources
Full Text Sources
Medical
Miscellaneous

