

miRNA analysis reveals novel dysregulated pathways in amyotrophic lateral sclerosis
- PMID: 36219176
- PMCID: PMC9990999
- DOI: 10.1093/hmg/ddac250
miRNA analysis reveals novel dysregulated pathways in amyotrophic lateral sclerosis
Abstract
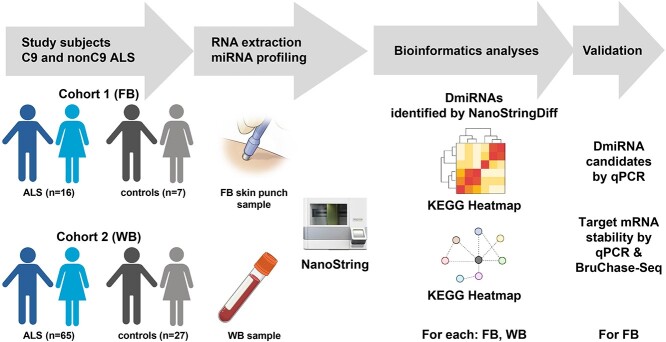
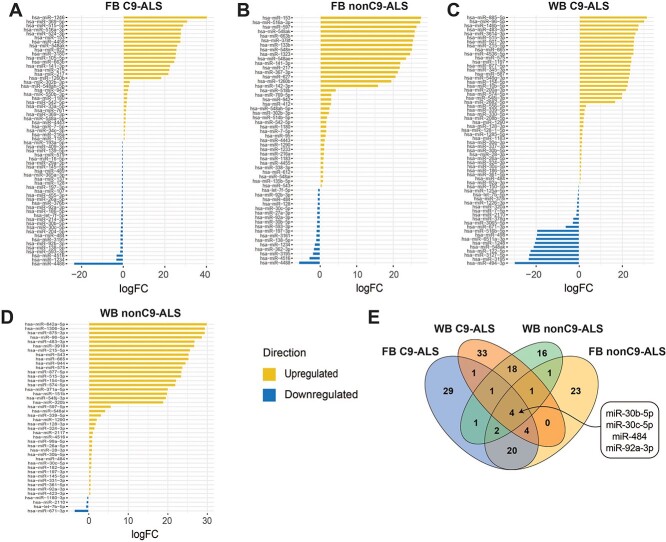
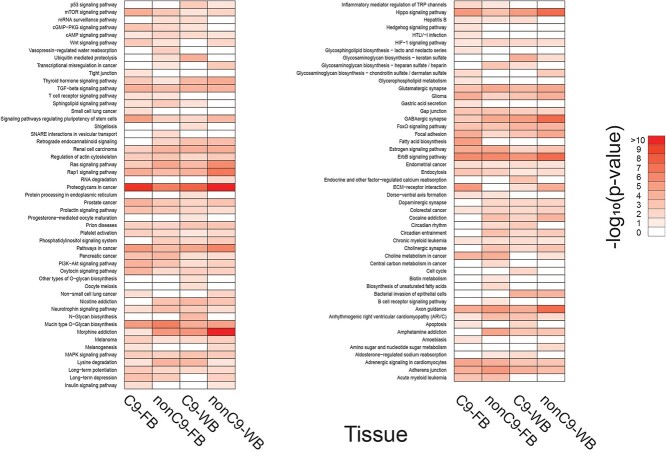
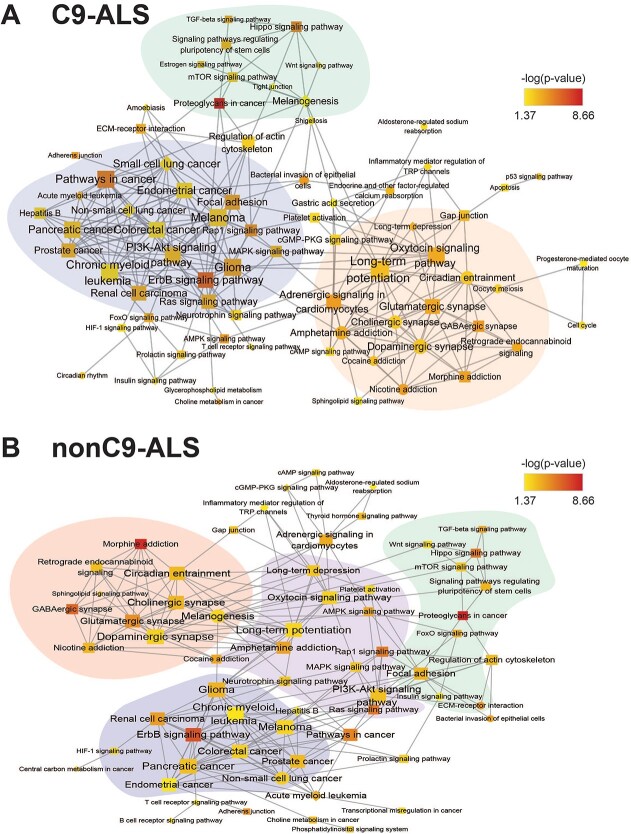
Amyotrophic lateral sclerosis (ALS) is a fatal neurodegenerative disease. Its complex pathogenesis and phenotypic heterogeneity hinder therapeutic development and early diagnosis. Altered RNA metabolism is a recurrent pathophysiologic theme, including distinct microRNA (miRNA) profiles in ALS tissues. We profiled miRNAs in accessible biosamples, including skin fibroblasts and whole blood and compared them in age- and sex-matched healthy controls versus ALS participants with and without repeat expansions to chromosome 9 open reading frame 72 (C9orf72; C9-ALS and nonC9-ALS), the most frequent ALS mutation. We identified unique and shared profiles of differential miRNA (DmiRNA) levels in each C9-ALS and nonC9-ALS tissues versus controls. Fibroblast DmiRNAs were validated by quantitative real-time PCR and their target mRNAs by 5-bromouridine and 5-bromouridine-chase sequencing. We also performed pathway analysis to infer biological meaning, revealing anticipated, tissue-specific pathways and pathways previously linked to ALS, as well as novel pathways that could inform future research directions. Overall, we report a comprehensive study of a miRNA profile dataset from C9-ALS and nonC9-ALS participants across two accessible biosamples, providing evidence of dysregulated miRNAs in ALS and possible targets of interest. Distinct miRNA patterns in accessible tissues may also be leveraged to distinguish ALS participants from healthy controls for earlier diagnosis. Future directions may look at potential correlations of miRNA profiles with clinical parameters.
© The Author(s) 2022. Published by Oxford University Press. All rights reserved. For Permissions, please email: journals.permissions@oup.com.
Figures
Similar articles
-
Understanding the relationship between cerebellum and the frontal-cortex region of C9orf72-related amyotrophic lateral sclerosis: A comparative analysis of genetic features.PLoS One. 2024 May 16;19(5):e0301267. doi: 10.1371/journal.pone.0301267. eCollection 2024. PLoS One. 2024. PMID: 38753768 Free PMC article.
-
Longitudinal imaging in C9orf72 mutation carriers: Relationship to phenotype.Neuroimage Clin. 2016 Oct 22;12:1035-1043. doi: 10.1016/j.nicl.2016.10.014. eCollection 2016. Neuroimage Clin. 2016. PMID: 27995069 Free PMC article. Clinical Trial.
-
Different CSF protein profiles in amyotrophic lateral sclerosis and frontotemporal dementia with C9orf72 hexanucleotide repeat expansion.J Neurol Neurosurg Psychiatry. 2020 May;91(5):503-511. doi: 10.1136/jnnp-2019-322476. Epub 2020 Mar 4. J Neurol Neurosurg Psychiatry. 2020. PMID: 32132225
-
The emerging roles of microRNAs in the pathogenesis of frontotemporal dementia-amyotrophic lateral sclerosis (FTD-ALS) spectrum disorders.J Neurogenet. 2014 Mar-Jun;28(1-2):30-40. doi: 10.3109/01677063.2013.876021. Epub 2014 Feb 10. J Neurogenet. 2014. PMID: 24506814 Free PMC article. Review.
-
MicroRNA Metabolism and Dysregulation in Amyotrophic Lateral Sclerosis.Mol Neurobiol. 2018 Mar;55(3):2617-2630. doi: 10.1007/s12035-017-0537-z. Epub 2017 Apr 18. Mol Neurobiol. 2018. PMID: 28421535 Review.
Cited by
-
A microRNA diagnostic biomarker for amyotrophic lateral sclerosis.Brain Commun. 2024 Sep 13;6(5):fcae268. doi: 10.1093/braincomms/fcae268. eCollection 2024. Brain Commun. 2024. PMID: 39280119 Free PMC article.
-
An ALS-associated mutation dysregulates microglia-derived extracellular microRNAs in a sex-specific manner.Dis Model Mech. 2024 May 1;17(5):dmm050638. doi: 10.1242/dmm.050638. Epub 2024 May 29. Dis Model Mech. 2024. PMID: 38721655 Free PMC article.
-
FUS Alters circRNA Metabolism in Human Motor Neurons Carrying the ALS-Linked P525L Mutation.Int J Mol Sci. 2023 Feb 6;24(4):3181. doi: 10.3390/ijms24043181. Int J Mol Sci. 2023. PMID: 36834591 Free PMC article.
-
Epigenetic age acceleration is associated with occupational exposures, sex, and survival in amyotrophic lateral sclerosis.EBioMedicine. 2024 Nov;109:105383. doi: 10.1016/j.ebiom.2024.105383. Epub 2024 Oct 5. EBioMedicine. 2024. PMID: 39369616 Free PMC article.
-
Nanoplastics and Neurodegeneration in ALS.Brain Sci. 2024 May 7;14(5):471. doi: 10.3390/brainsci14050471. Brain Sci. 2024. PMID: 38790450 Free PMC article. Review.
References
-
- Bensimon, G., Lacomblez, L. and Meininger, V. (1994) A controlled trial of riluzole in amyotrophic lateral sclerosis. ALS/Riluzole Study Group. N. Engl. J. Med., 330, 585–591. - PubMed
-
- Writing, G. and Edaravone, A.L.S.S.G. (2017) Safety and efficacy of edaravone in well defined patients with amyotrophic lateral sclerosis: a randomised, double-blind, placebo-controlled trial. Lancet Neurol., 16, 505–512. - PubMed
-
- Kaji, R., Imai, T., Iwasaki, Y., Okamoto, K., Nakagawa, M., Ohashi, Y., Takase, T., Hanada, T., Shimizu, H., Tashiro, K. et al. (2019) Ultra-high-dose methylcobalamin in amyotrophic lateral sclerosis: a long-term phase II/III randomised controlled study. J. Neurol. Neurosurg. Psychiatry, 90, 451–457. - PMC - PubMed
Publication types
MeSH terms
Substances
Grants and funding
- UL1TR002240/GF/NIH HHS/United States
- R01 TS000289/TS/ATSDR CDC HHS/United States
- R01TS000289/ACL/ACL HHS/United States
- R01 TS000327/TS/ATSDR CDC HHS/United States
- K23 ES027221/ES/NIEHS NIH HHS/United States
- R01NS120926/NS/NINDS NIH HHS/United States
- R01ES030049/ES/NIEHS NIH HHS/United States
- UL1 TR002240/TR/NCATS NIH HHS/United States
- R01 NS120926/NS/NINDS NIH HHS/United States
- R01 NS127188/NS/NINDS NIH HHS/United States
- R01 ES030049/ES/NIEHS NIH HHS/United States
- R21 NS102960/NS/NINDS NIH HHS/United States
LinkOut - more resources
Full Text Sources
Medical
Research Materials
Miscellaneous
