. 2022 Oct 10;18(10):e1010446.
doi: 10.1371/journal.pgen.1010446. eCollection 2022 Oct.

A two-tiered system for selective receptor and transporter protein degradation

Affiliations

A two-tiered system for selective receptor and transporter protein degradation

Charlotte Kathleen Golden et al. PLoS Genet. .

Abstract

Diverse physiology relies on receptor and transporter protein down-regulation and degradation mediated by ESCRTs. Loss-of-function mutations in human ESCRT genes linked to cancers and neurological disorders are thought to block this process. However, when homologous mutations are introduced into model organisms, cells thrive and degradation persists, suggesting other mechanisms compensate. To better understand this secondary process, we studied degradation of transporter (Mup1) or receptor (Ste3) proteins when ESCRT genes (VPS27, VPS36) are deleted in Saccharomyces cerevisiae using live-cell imaging and organelle biochemistry. We find that endocytosis remains intact, but internalized proteins aberrantly accumulate on vacuolar lysosome membranes within cells. Here they are sorted for degradation by the intralumenal fragment (ILF) pathway, constitutively or when triggered by substrates, misfolding or TOR activation in vivo and in vitro. Thus, the ILF pathway functions as fail-safe layer of defense when ESCRTs disregard their clients, representing a two-tiered system that ensures degradation of surface polytopic proteins.


Conflict of interest statement

The authors have declared that no competing interests exist.

Figures
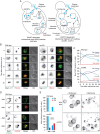
Fig 1
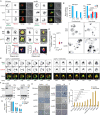
Fig 1. Mup1 accumulates on vacuole membranes in vps36Δ cells after addition of methionine.
(A) Illustration describing how surface ESCRT-client proteins like Mup1 may be rerouted to the vacuole membrane and ILF pathway for degradation when MVB formation is blocked. (B) Fluorescence and DIC micrographs showing route taken by Mup1-GFP from the plasma membrane to the vacuole lumen in response to methionine over 30 minutes in live wild type or vps36Δ cells stained with FM4-64. (C) Proportion of wild type or vps36Δ cells that show Mup1-GFP fluorescence on the plasma membrane (PM), intracellular puncta, vacuole membrane (Vac mem) or vacuole lumen over time after methionine addition. n values for wild type (0, 5, 10, 20, 30 min) are 242, 327, 229, 267, 266 cells; vps36Δ are 216, 216, 214, 196, 222 cells. (D) Fluorescence and DIC micrographs of live wild type or vps36Δ cells stained with FM4-64 expressing Mup1-pHluorin before or 10 minutes after addition of methionine. (E) Proportion of wild type or vps36Δ cells that show Mup1-pHluorin fluorescence on the plasma membrane (PM) or vacuole membranes (VM) before or 10 minutes after methionine addition. Micrographs show Mup1-pHluorin location within cells. n values for wild type are 318, 304 cells; vps36Δ are 324, 348 cells analyzed before or after methionine addition respectively. Means ± S.E.M. and results from Student t-test are shown. Cells were stained with FM4-64 to label vacuole membranes. Arrowheads indicate Mup1-GFP or Mup1-pHluorin on vacuole membranes. Scale bars, 2 μm.
Fig 2
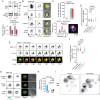
Fig 2. Mup1 is degraded by vacuoles in vps36Δ cells.
(A) Fluorescence and DIC micrographs of live wild type or vps36Δ cells stained with FM4-64 and expressing Mup1-GFP before or 30 minutes after addition of methionine. (B) Western blot analysis of whole cell lysates prepared from wild type (WT) or vps36Δ cells expressing Mup1-GFP before (0 minutes) or 5–120 minutes after addition of methionine. Blots were stained for GFP or glucose-6-phosphate dehydrogenase (G6PDH; as load controls). Estimated molecular weights shown. (C) Intact Mup1-GFP band densities relative to 0 minutes and normalized to corresponding G6PDH densities were calculated for each time shown in B. n = 3 for each strain tested. (D) Western blot analysis of whole cell lysates prepared from wild type (WT) or vps36Δ cells expressing Mup1-GFP before (0 minutes) or 30 minutes after addition of methionine in the presence or absence of 10 μM bafilomycin A1 (BafA1). Blots were stained for GFP or glucose-6-phosphate dehydrogenase (G6PDH; as load controls). Estimated molecular weights shown. (E) Intact Mup1-GFP band densities at 30 minutes relative to 0 minutes and normalized to corresponding G6PDH densities were calculated for each time shown in D. n = 3 for each strain tested. (F) Fluorescence and DIC micrographs of live wild type or vps36Δ cells stained with FM4-64 and expressing Mup1-GFP 30 minutes after addition of methionine in the presence of bafilomycin A1. Means ± S.E.M. and results from Student t-test are shown. Cells were stained with FM4-64 to label vacuole membranes. Arrowheads indicate Mup1-GFP or Mup1-pHluorin on vacuole membranes. Scale bars, 2 μm.
Fig 3
Fig 3. Methionine triggers Mup1 degradation by the ILF pathway in vps36Δ cells.
(A) Cartoon illustrating how Mup1 on vacuole membranes may be sorted into boundaries and ILFs formed during homotypic vacuole fusion. Whereas Fet5 is depleted from boundaries and ILFs, and exclusively resides on outside membranes. (B) Fluorescence and DIC micrographs of live vps36Δ cells stained with FM4-64 expressing pHluorin-tagged Mup1 before or 10 minutes after addition of methionine. A 3-dimensional Mup1-pHluorin fluorescence intensity (FI) plot and line plots of pHluorin or FM4-64 fluorescence intensity (line shown in above micrograph) indicate boundary membrane localization after methionine addition. (C) Mup1-pHluorin, Fet5-GFP or Fth1-GFP fluorescence measured within boundary membranes of docked vacuoles within live wild type or vps36Δ cells in the presence of methionine. 52 (Mup1-pHluroin, vps36Δ), 82 (Fet5-GFP, vps36Δ), 70 (Fet5-GFP, wild type), 97 (Fth1-GFP, wild type) boundaries were analyzed. Mup1-pHluorin was absent from vacuole membranes without methionine and thus was not analyzed. (D) Snapshots from time-lapse movie showing a homotypic vacuole fusion event within a live vps36Δ cell expressing Mup1-pHluorin stained with FM4-64 10 minutes after methionine addition. Dotted lines indicate cell perimeter; arrowheads indicate newly formed ILF. See S1 Video. (E) Analysis of data shown in D indicating proportion of vps36Δ cells that displayed a vacuole fusion event within 5 minutes before (n = 1,446) or 10 minutes after methionine addition (1,057). (F) Western blot analysis (left) of whole cell lysates prepared from wild type (WT), vps36Δ, vam3Δ, or vps36Δvam3Δ cells expressing Mup1-GFP before (0 minutes) or 30 minutes after addition of methionine. Estimated molecular weights shown. Intact Mup1-GFP band densities relative to 0 minutes WT were calculated for each time shown (right). n = 3 for each strain tested. Means (bars) ± S.E.M. and results from Student t-test are shown. Vacuole membranes were stained with FM4-64. Scale bars, 1 μm.
Fig 4
Fig 4. The ILF pathway degrades Mup1 in response to heat stress or cycloheximide in cells missing ESCRTs.
(A) Fluorescence and DIC micrographs of live wild type or vps36Δ cells stained with FM4-64 expressing Mup1-pHluorin before (control) or after addition of 100 μM cycloheximide (CHX) or heat stress (HS; 42°C for 15 minutes). Arrowheads indicate Mup1-pHluorin on vacuole membranes. (B) Proportion of wild type or vps36Δ cells showing Mup1-pHluorin fluorescence on the plasma membrane (PM) or vacuole membranes (VM) before or after treatment with cycloheximide (CHX) or heat stress (HS). (below) Micrographs show Mup1-pHluorin location within cells; arrowheads indicate vacuole membranes. Number of cells analyzed (control, HS, CHX) are: WT (318, 315, 365), vps36Δ (324,327,339). (C) Fluorescence and DIC micrographs of live wild type or vps27Δ cells stained with FM4-64 expressing Mup1-GFP after addition of cycloheximide or heat stress. Three-dimensional Mup1-GFP fluorescence intensity (FI) plots and line plots of GFP or FM4-64 for lines shown above in micrographs indicate boundary membrane localization. (D) Mup1-GFP fluorescence measured within boundary membranes between docked vacuoles within live vps27Δ cells before (control; CTL) or after addition of cycloheximide (CHX) or heat stress (HS). Mup1-GFP was absent from vacuole membranes under control conditions and not analyzed (n.a.). Number of vps27Δ cells analyzed (HS, CHX) are: 60, 28. (E) Snapshots from time-lapse movies showing homotypic vacuole fusion events within live vps27Δ cells stained with FM4-64 expressing Mup1-GFP treated with cycloheximide or heat stress. Dotted lines indicate cell perimeters; arrowheads indicate newly formed ILFs. See S2 and S3 Videos. (F) Western blot analysis of whole cell lysates prepared from wild type or vps36Δ cells expressing Mup1-GFP before (control; CTL) or after heat stress (HS) or cycloheximide (CHX) treatment. Blots are stained with anti-GFP or anti-G6PDH antibodies. Estimated molecular weights are shown. (G) Intact Mup1-GFP band densities relative to control and normalized to load controls (G6PDH) were calculated for each condition shown in F. n = 3 for each strain tested. (H) Light micrographs showing methylene blue (MB) stained cultures of wild type, vps27Δ, vps36Δ, vps23Δ, snf7Δ, vam3Δ, vps36Δvam3Δ, ssa2Δ, hsc82Δ or fet5Δ cells before or after heat stress (HS). Arrowheads indicate MB-positive cells. (I) Images in H were used to measure proportion of dead, MB-positive cells in the population. Number of cells analyzed (control, HS) are: 3,232, 1,995 wild type; 2,023, 1,647 vps27Δ; 2,226, 1,548 vps36Δ; 1,877, 1,743 vps23Δ; 1,563, 1,470 snf7Δ; 3,021, 1,971 vam3Δ; 2,081, 1,540 vps36Δvam3Δ; 3,305, 2,017 ssa2Δ; 3,401, 2,001 hsc82Δ; 2,061, 1,323 fet5Δ. Means (bars) ± S.E.M. and results from Student t-test are shown. Vacuole membranes were stained with FM4-64. Scale bars, 1 μm (except in H, 5 μm).
Fig 5
Fig 5. Molecular machinery for Mup1 degradation by the ILF pathway co-purifies with vacuoles.
(A) Fluorescence micrographs of vacuoles isolated from wild type or vps27Δ cells expressing Mup1-GFP before (0 minutes) or after up to 120 minutes of fusion. Vacuole membranes were stained with FM4-64. (B,C) Vacuole radius (C) or Mup1-GFP fluorescence measured within the lumen or on outside membranes (B) of vacuoles isolated from wild type (WT) or vps27Δ cells before (0) or after fusion (up to 120 minutes). n values for 0, 30, 60, 90,120 minutes are 63, 52, 83, 115, 114 (WT); 93, 177, 128, 126, 104 (vps27Δ) vacuoles analyzed. (D) Fluorescence micrographs of vacuoles isolated from vps27Δ cells expressing Mup1-GFP after 30 minutes of fusion in the absence (control) or presence of heat stress (HS), and with or without fusion inhibitors (4 μM rGdi1 and 3.2 μM rGyp1-46). Vacuole membranes were stained with FM4-64 and 3-dimensional fluorescence intensity (FI) plots of Mup1-GFP are shown. Arrowheads indicate boundary membranes either enriched with (closed) or depleted of (open) Mup1-GFP. (E, G) Mup1-GFP fluorescence measured within boundary membranes (E) or the lumen (G) of vacuoles isolated from vps27Δ cells in the absence (control; CTL) or presence of heat stress (HS), and with or without fusion inhibitors (GDI) after 30 minutes of fusion. n values for CTL, HS are 176, 76 vacuoles analyzed without GDI; 73, 52 with GDI. (F) Relative fluorescence of vacuoles isolated from WT or vps27Δ cells expressing Mup1-pHluorin recorded over time during homotypic vacuole fusion in vitro in the absence (control; CTL) or presence of heat stress (HS) and with or without fusion inhibitors (GDI). n = 3 for each condition, representative traces shown. (H) Western blot analysis of Mup1-GFP degradation before (0) or after (90 minutes) fusion of vacuoles isolated from vps27Δ cells in the absence or presence of heat stress (HS) pretreated without (top) or with (bottom) fusion inhibitors (GDI). Blots were stained with antibodies to GFP or Pho8 (load control). Estimated molecular weights indicated. Intact Mup1-GFP band densities relative to control (0 min) normalized to load controls were calculated for each condition shown. n = 3 for each condition tested. Means (bars) ± S.E.M. and results of Student t-tests are shown. Scale bars, 1 μm.
Fig 6
Fig 6. MVB and ILF pathways mediate degradation of Ste3.
(A) Western blot analysis of whole cell lysates prepared from wild type (WT) or vps27Δ cells expressing Ste3-GFP that were untreated or exposed to heat stress (HS). Blots were stained for GFP or G6PDH (load controls). Estimated molecular weights are shown. Intact Ste3-GFP band densities relative to control and normalized to corresponding G6PDH densities were calculated. n = 3 for each strain tested. (B) Fluorescence and DIC micrographs of live wild type or vps27Δ cells stained with FM4-64 expressing Ste3-GFP before (control) or after heat stress (HS). Arrowheads indicate vacuole membranes. (C) Proportion of WT or vps27Δ cells that show Ste3-GFP fluorescence on vacuole membranes before (control) or after heat stress. 885, 964 WT and 284, 166 vps27Δ cells were analyzed before or after heat stress respectively. A 3-dimensional Mup1-GFP fluorescence intensity (FI) plot and line plots of GFP or FM4-64 for line shown in B indicate vacuole and boundary membrane localization. (D,F) Ste3-GFP fluorescence measured within boundary membranes (D) or lumen (F) of vacuoles within live vps27Δ cells before (n = 93) or after heat stress (HS; n = 73). For comparison, boundary fluorescence of Fet5-GFP in vps36Δ or Mup1-GFP in vps27Δ cells after methionine addition are shown (see Fig 2C). (E) Snapshots from a time-lapse movie showing a homotypic vacuole fusion event within a live vps27Δ cell stained with FM4-64 expressing Ste3-GFP after heat stress. Dotted line indicates cell perimeter; arrowhead indicates newly formed ILF. See S4 Video. (G) Fluorescence and DIC micrographs of live wild type cells stained with FM4-64 expressing Ste3-pHluorin before (control) or after heat stress. (H) Proportion of wild type cells that show Ste3-pHluorin fluorescence on the plasma membrane (PM) or vacuole membranes (VM) before (control, CTL; n = 195) or after heat stress (HS; n = 198). (I) Micrographs show Ste3-pHluorin location within cells; arrowheads indicate vacuole membranes. Means (bars) ± S.E.M. and results of Student t-tests are shown. Cells were stained with FM4-64 to label vacuole membranes. Scale bars, 1 μm.
Fig 7
Fig 7. A two-tiered system ensures surface polytopic protein down-regulation.
Illustration showing how surface transporter and receptor proteins like Mup1 and Ste3, respectively, are degraded by a two-tiered system consisting of the MVB and ILF pathways.

Similar articles

Cited by

References

    1. Katzmann DJ, Odorizzi G, Emr SD. Receptor downregulation and multivesicular-body sorting. Nat Rev Mol Cell Biol. 2002;3:893–905. doi: 10.1038/nrm973 - DOI - PubMed
    1. Palacios F, Tushir JS, Fujita Y, D’Souza-Schorey C. Lysosomal targeting of E-cadherin: a unique mechanism for the down-regulation of cell-cell adhesion during epithelial to mesenchymal transitions. Mol Cell Biol. 2005;25:389–402. doi: 10.1128/MCB.25.1.389-402.2005 - DOI - PMC - PubMed
    1. Rodahl LM, Stuffers S, Lobert VH, Stenmark H. The role of ESCRT proteins in attenuation of cell signalling. Biochem Soc Trans. 2009;37:137–142. doi: 10.1042/BST0370137 - DOI - PubMed
    1. Lobert VH, Stenmark H. Cell polarity and migration: emerging role for the endosomal sorting machinery. Physiology (Bethesda). 2011;26:171–180. doi: 10.1152/physiol.00054.2010 - DOI - PubMed
    1. Zhou R, Kabra R, Olson DR, Piper RC, Snyder PM. Hrs controls sorting of the epithelial Na+ channel between endosomal degradation and recycling pathways. J Biol Chem. 2010;285:30523–30530. - PMC - PubMed

Publication types

MeSH terms

Substances

Grants and funding

This work was supported by Discovery Program grant #RGPIN/2017-06652 to C.L.B from the Natural Sciences and Engineering Research Council of Canada (https://www.nserc-crsng.gc.ca). The funders had no role in study design, data collection and analysis, decision to publish, or preparation of the manuscript.

LinkOut - more resources