. 2022 Sep 21:10:1004117.
doi: 10.3389/fpubh.2022.1004117. eCollection 2022.

Development and validation of chest CT-based imaging biomarkers for early stage COVID-19 screening

Affiliations

Development and validation of chest CT-based imaging biomarkers for early stage COVID-19 screening

Xiao-Ping Liu et al. Front Public Health. .

Abstract

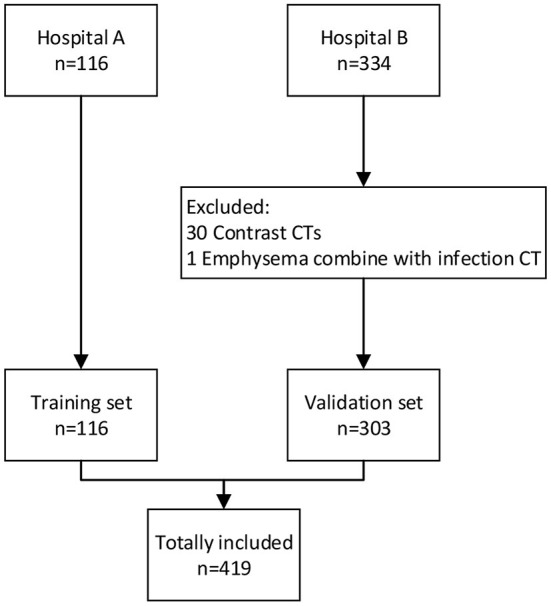
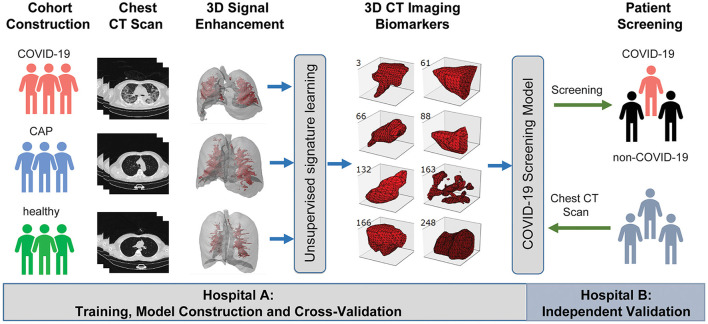
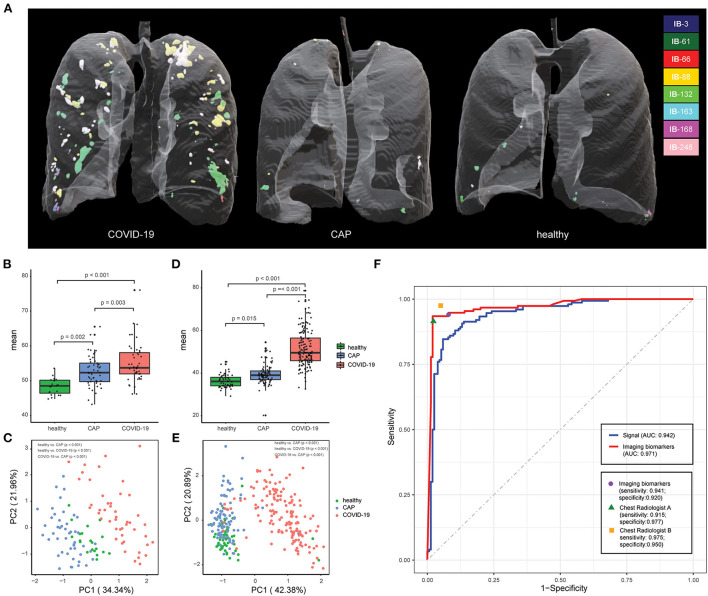
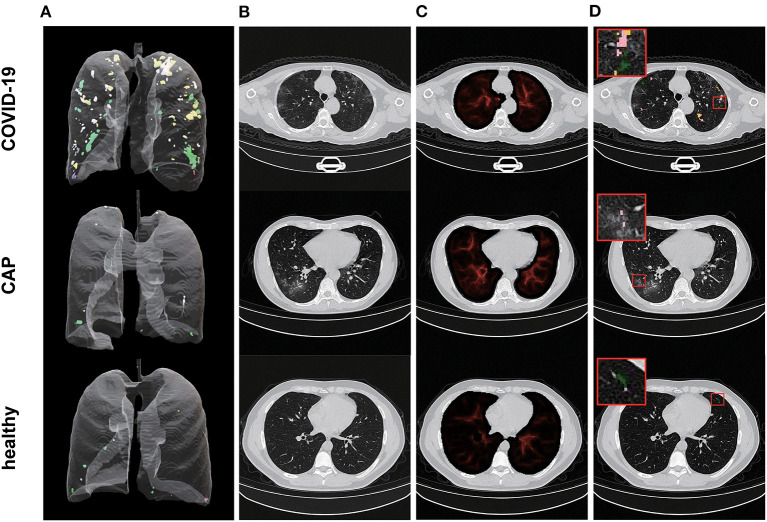
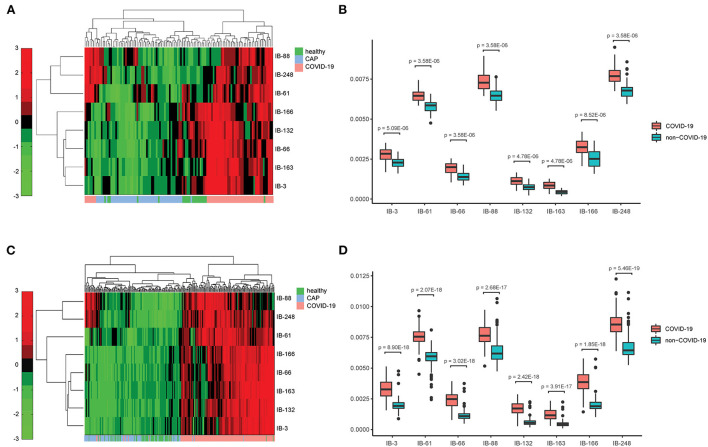
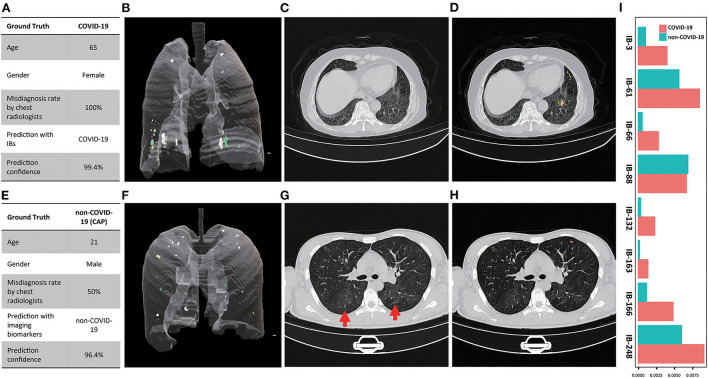
Coronavirus Disease 2019 (COVID-19) is currently a global pandemic, and early screening is one of the key factors for COVID-19 control and treatment. Here, we developed and validated chest CT-based imaging biomarkers for COVID-19 patient screening from two independent hospitals with 419 patients. We identified the vasculature-like signals from CT images and found that, compared to healthy and community acquired pneumonia (CAP) patients, COVID-19 patients display a significantly higher abundance of these signals. Furthermore, unsupervised feature learning led to the discovery of clinical-relevant imaging biomarkers from the vasculature-like signals for accurate and sensitive COVID-19 screening that have been double-blindly validated in an independent hospital (sensitivity: 0.941, specificity: 0.920, AUC: 0.971, accuracy 0.931, F1 score: 0.929). Our findings could open a new avenue to assist screening of COVID-19 patients.

Keywords: Coronavirus Disease 2019 (COVID-19); artificial intelligence; biomedical imaging application; chest CT image; imaging biomarker; multicentric retrospective study.


Conflict of interest statement

The authors declare that the research was conducted in the absence of any commercial or financial relationships that could be construed as a potential conflict of interest.

Figures

Figure 1
Figure 1
The flowchart for the selection of the participants.
Figure 2
Figure 2
A graphic illustration of the study design. A case-control study was designed to identify chest CT-based imaging biomarkers for COVID-19 patient screening. Biomarker discovery and biomarker-based predictive model construction were conducted using the data from Hospital A (training cohort), which were validated in Hospital B (validation cohort) with the double-blind design.
Figure 3
Figure 3
Chest CT-based imaging biomarkers accurately predicts COVID-19. (A) Representative examples for 3D multispectral imaging biomarker visualization in COVID-19, CAP and healthy samples. (B) The boxplot shows differences in the vasculature-like signals among healthy, community acquired pneumonia (CAP), and COVID-19 patients in the training cohort. The p-values were obtained by the non-parametric Mann–Whitney test. (C) PCA of 8 imaging biomarkers in the training cohort. Twenty healthy participants (green dots), 49 CAP patients (blue dots), and 47 COVID-19 patients (red dots). The p-values were obtained from permutational multivariate analysis of variance (PERMANOVA). (D) The boxplot shows differences in the vasculature-like signals among healthy, community acquired pneumonia (CAP), and COVID-19 patients in the validation cohort. The p-values were obtained by the non-parametric Mann–Whitney test. (E) PCA of 8 imaging biomarkers in the validation cohort. Sixty healthy participants (green dots), 90 CAP patients (blue dots), and 153 COVID-19 patients (red dots). The p-values were obtained from permutational multivariate analysis of variance (PERMANOVA). (F) Screening performance of signal-based model, imaging biomarker-based model, and two COVID-19 experienced radiologist on validation cohort.
Figure 4
Figure 4
Illustration of representative CT image and the corresponding vasculature-structure enhancement and multi-spectral staining in COVID-19, CAP and healthy samples. (A) Representative examples for 3D multispectral imaging biomarker visualization (3D animations are provided by Supplementary Videos 4–6); (B) Representative 2D CT images; (C) Corresponding 2D vasculature-structure enhancement (enhancement for entire chest CTs are provided by Supplementary Videos 1–3); (D) Corresponding 2D multi-spectral staining (2D multi-spectral staining for entire chest CTs are provided by Supplementary Videos 7–9).
Figure 5
Figure 5
Chest CT-based imaging biomarkers provide consistent and significant distinction between COVID-19 patients and others across hospitals. (A) Heatmap of the relative abundance of imaging biomarkers shows distinct clusters with respect to COVID-19 and non-COVID-19 groups in training cohort; (B) Individual imaging biomarker shows significantly higher relative abundance in COVID-19 patients in training cohort; (C). Heatmap of the relative abundance of imaging biomarkers shows distinct clusters with respect to COVID-19 and non-COVID-19 groups in validation cohort; (D) Individual imaging biomarker shows significantly higher relative abundance in COVID-19 patients in validation cohort.
Figure 6
Figure 6
Examples of misdiagnosed cases by participating chest radiologist(s). (A) Characteristics of the COVID-19 patient and the corresponding diagnosis (chest radiologists)and screening (imaging biomarkers) results; (B) 3D multi-spectral staining of the COVID-19 patient (3D animation can be found in Supplementary Video 10); (C) Representative CT image slice of the COVID-19 shows no typical abnormity related to COVID-19, which led to the false negative decision of both chest radiologist; (D) the corresponding 2D multi-spectral staining of the selected CT image slice (2D animation of the entire CT scan can be found in Supplementary Video 12); (E) Characteristics of the CAP patient and the corresponding diagnosis and screening results; (F) 3D multi-spectral staining of the CAP patient (3D animation can be found in Supplementary Video 11); (G) Representative CT image slice of the CAP patient shows the typical while subtle image characteristics (GGO, marked by red arrows) of the COVID-19 in the upper lobe of both lungs, which led to the false positive decision by one of the chest radiologists; (H) The corresponding 2D multi-spectral staining of the selected CT image slice (2D animation of the entire CT scan can be found in Supplementary Video 13); (I) Relative abundance of imaging biomarkers differentiate the COVID-19 from CAP patient.

Similar articles

Cited by

  • Thoracic imaging tests for the diagnosis of COVID-19.
    Islam N, Ebrahimzadeh S, Salameh JP, Kazi S, Fabiano N, Treanor L, Absi M, Hallgrimson Z, Leeflang MM, Hooft L, van der Pol CB, Prager R, Hare SS, Dennie C, Spijker R, Deeks JJ, Dinnes J, Jenniskens K, Korevaar DA, Cohen JF, Van den Bruel A, Takwoingi Y, van de Wijgert J, Damen JA, Wang J, McInnes MD; Cochrane COVID-19 Diagnostic Test Accuracy Group. Islam N, et al. Cochrane Database Syst Rev. 2021 Mar 16;3(3):CD013639. doi: 10.1002/14651858.CD013639.pub4. Cochrane Database Syst Rev. 2021. Update in: Cochrane Database Syst Rev. 2022 May 16;5:CD013639. doi: 10.1002/14651858.CD013639.pub5. PMID: 33724443 Free PMC article. Updated.
  • A Learning-Based Model to Evaluate Hospitalization Priority in COVID-19 Pandemics.
    Zheng Y, Zhu Y, Ji M, Wang R, Liu X, Zhang M, Liu J, Zhang X, Qin CH, Fang L, Ma S. Zheng Y, et al. Patterns (N Y). 2020 Sep 11;1(6):100092. doi: 10.1016/j.patter.2020.100092. Epub 2020 Aug 3. Patterns (N Y). 2020. PMID: 32838344 Free PMC article.
  • Thoracic imaging tests for the diagnosis of COVID-19.
    Ebrahimzadeh S, Islam N, Dawit H, Salameh JP, Kazi S, Fabiano N, Treanor L, Absi M, Ahmad F, Rooprai P, Al Khalil A, Harper K, Kamra N, Leeflang MM, Hooft L, van der Pol CB, Prager R, Hare SS, Dennie C, Spijker R, Deeks JJ, Dinnes J, Jenniskens K, Korevaar DA, Cohen JF, Van den Bruel A, Takwoingi Y, van de Wijgert J, Wang J, Pena E, Sabongui S, McInnes MD; Cochrane COVID-19 Diagnostic Test Accuracy Group. Ebrahimzadeh S, et al. Cochrane Database Syst Rev. 2022 May 16;5(5):CD013639. doi: 10.1002/14651858.CD013639.pub5. Cochrane Database Syst Rev. 2022. PMID: 35575286 Free PMC article. Review.

References

    1. Velavan TP, Meyer CG. The COVID-19 epidemic. Trop Med Int Health. (2020) 25:278–80. 10.1111/tmi.13383 - DOI - PMC - PubMed
    1. Sun P, Lu X, Xu C, Sun W, Pan B. Understanding of COVID-19 based on current evidence. J Med Virol. (2020) 92:548–51. 10.1002/jmv.25722 - DOI - PMC - PubMed
    1. Tahamtan A, Ardebili A. Real-time RT-PCR in COVID-19 detection: issues affecting the results. Expert Rev Mol Diagn. (2020) 20:453–4. 10.1080/14737159.2020.1757437 - DOI - PMC - PubMed
    1. Xie X, Zhong Z, Zhao W, Zheng C, Wang F, Liu J. Chest CT for typical coronavirus disease 2019 (COVID-19) pneumonia: relationship to negative RT-PCR testing. Radiology. (2020) 296:E41–5. 10.1148/radiol.2020200343 - DOI - PMC - PubMed
    1. Pecoraro V, Negro A, Pirotti T, Trenti T. Estimate false-negative RT-PCR rates for SARS-CoV-2. A systematic review and meta-analysis. Eur J Clin Invest. (2022) 52:e13706. 10.1111/eci.13706 - DOI - PMC - PubMed