Post-translational modifications glycosylation and phosphorylation of the major hepatic plasma protein fetuin-A are associated with CNS inflammation in children
- PMID: 36206263
- PMCID: PMC9544022
- DOI: 10.1371/journal.pone.0268592
Post-translational modifications glycosylation and phosphorylation of the major hepatic plasma protein fetuin-A are associated with CNS inflammation in children
Abstract
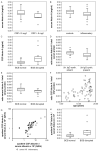
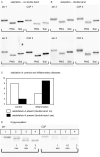
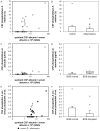
Fetuin-A is a liver derived plasma protein showing highest serum concentrations in utero, preterm infants, and neonates. Fetuin-A is also present in cerebrospinal fluid (CSF). The origin of CSF fetuin-A, blood-derived via the blood-CSF barrier or synthesized intrathecally, is presently unclear. Fetuin-A prevents ectopic calcification by stabilizing calcium and phosphate as colloidal calciprotein particles mediating their transport and clearance. Thus, fetuin-A plays a suppressive role in inflammation. Fetuin-A is a negative acute-phase protein under investigation as a biomarker for multiple sclerosis (MS). Here we studied the association of pediatric inflammatory CNS diseases with fetuin-A glycosylation and phosphorylation. Paired blood and CSF samples from 66 children were included in the study. Concentration measurements were performed using a commercial human fetuin-A/AHSG ELISA. Of 60 pairs, 23 pairs were analyzed by SDS-PAGE following glycosidase digestion with PNGase-F and Sialidase-AU. Phosphorylation was analyzed in 43 pairs by Phos-TagTM acrylamide electrophoresis following alkaline phosphatase digestion. Mean serum and CSF fetuin-A levels were 0.30 ± 0.06 mg/ml and 0.644 ± 0.55 μg/ml, respectively. This study showed that serum fetuin-A levels decreased in inflammation corroborating its role as a negative acute-phase protein. Blood-CSF barrier disruption was associated with elevated fetuin-A in CSF. A strong positive correlation was found between the CSF fetuin-A/serum fetuin-A quotient and the CSF albumin/serum albumin quotient, suggesting predominantly transport across the blood-CSF barrier rather than intrathecal fetuin-A synthesis. Sialidase digestion showed increased asialofetuin-A levels in serum and CSF samples from children with neuroinflammatory diseases. Desialylation enhanced hepatic fetuin-A clearance via the asialoglycoprotein receptor thus rapidly reducing serum levels during inflammation. Phosphorylation of fetuin-A was more abundant in serum samples than in CSF, suggesting that phosphorylation may regulate fetuin-A influx into the CNS. These results may help establish Fetuin-A as a potential biomarker for neuroinflammatory diseases.
Conflict of interest statement
The authors have declared that no competing interests exist.
Figures


Similar articles
-
Effects of fetuin-A-containing calciprotein particles on posttranslational modifications of fetuin-A in HepG2 cells.Sci Rep. 2021 Apr 5;11(1):7486. doi: 10.1038/s41598-021-86881-0. Sci Rep. 2021. PMID: 33820929 Free PMC article.
-
Similar Albeit Not the Same: In-Depth Analysis of Proteoforms of Human Serum, Bovine Serum, and Recombinant Human Fetuin.J Proteome Res. 2018 Aug 3;17(8):2861-2869. doi: 10.1021/acs.jproteome.8b00318. Epub 2018 Jul 13. J Proteome Res. 2018. PMID: 29966421 Free PMC article.
-
Glycoproteogenomics: A Frequent Gene Polymorphism Affects the Glycosylation Pattern of the Human Serum Fetuin/α-2-HS-Glycoprotein.Mol Cell Proteomics. 2019 Aug;18(8):1479-1490. doi: 10.1074/mcp.RA119.001411. Epub 2019 May 16. Mol Cell Proteomics. 2019. PMID: 31097672 Free PMC article.
-
The role of fetuin-A in physiological and pathological mineralization.Calcif Tissue Int. 2013 Oct;93(4):355-64. doi: 10.1007/s00223-012-9690-6. Epub 2013 Jan 1. Calcif Tissue Int. 2013. PMID: 23277412 Review.
-
From infancy to aging: Biological and behavioral modifiers of Fetuin-A.Biochimie. 2016 May;124:141-149. doi: 10.1016/j.biochi.2015.12.016. Epub 2015 Dec 29. Biochimie. 2016. PMID: 26740309 Review.
Cited by
-
Sialylation-induced stabilization of dynamic glycoprotein conformations unveiled by time-aligned parallel unfolding and glycan release mass spectrometry.Chem Sci. 2024 Aug 12;15(35):14431-9. doi: 10.1039/d4sc03672g. Online ahead of print. Chem Sci. 2024. PMID: 39165727 Free PMC article.
-
Plasma Proteomic Variables Related to COVID-19 Severity: An Untargeted nLC-MS/MS Investigation.Int J Mol Sci. 2023 Feb 10;24(4):3570. doi: 10.3390/ijms24043570. Int J Mol Sci. 2023. PMID: 36834989 Free PMC article.
-
Identification of potential biomarkers for neuromyelitis optica by quantitative proteomics.Ann Clin Transl Neurol. 2024 May;11(5):1184-1196. doi: 10.1002/acn3.52033. Epub 2024 Feb 29. Ann Clin Transl Neurol. 2024. PMID: 38425144 Free PMC article.
References
-
- Ohnishi T, Nakamura O, Arakaki N, Daikuhara Y. Effect of phosphorylated rat fetuin on the growth of hepatocytes in primary culture in the presence of human hepatocyte-growth factor. Evidence that phosphorylated fetuin is a natural modulator of hepatocyte-growth factor. Eur J Biochem. 1997. Feb 1;243(3):753–61. doi: 10.1111/j.1432-1033.1997.00753.x - DOI - PubMed
MeSH terms
Substances
Grants and funding
LinkOut - more resources
Full Text Sources
Miscellaneous

