

Integrated metabolomics and transcriptomics insights on flavonoid biosynthesis of a medicinal functional forage, Agriophyllum squarrosum (L.), based on a common garden trial covering six ecotypes
- PMID: 36204072
- PMCID: PMC9530573
- DOI: 10.3389/fpls.2022.985572
Integrated metabolomics and transcriptomics insights on flavonoid biosynthesis of a medicinal functional forage, Agriophyllum squarrosum (L.), based on a common garden trial covering six ecotypes
Erratum in
-
Corrigendum: Integrated metabolomics and transcriptomics insights on flavonoid biosynthesis of a medicinal functional forage, Agriophyllum squarrosum (L.), based on a common garden trial covering six ecotypes.Front Plant Sci. 2022 Nov 23;13:1092707. doi: 10.3389/fpls.2022.1092707. eCollection 2022. Front Plant Sci. 2022. PMID: 36507418 Free PMC article.
Abstract
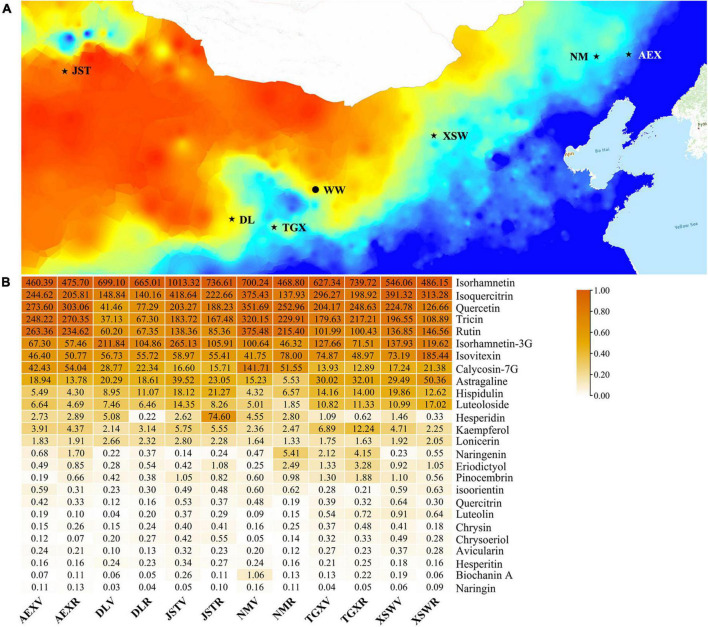
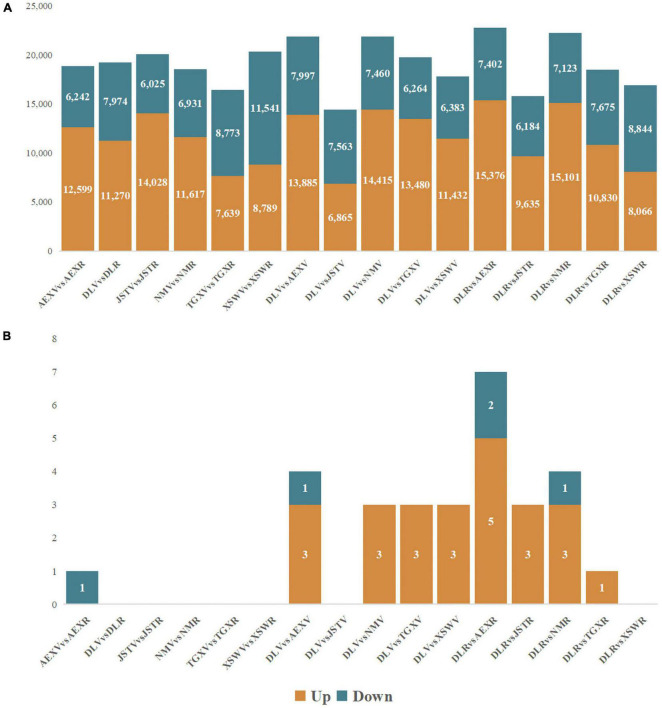
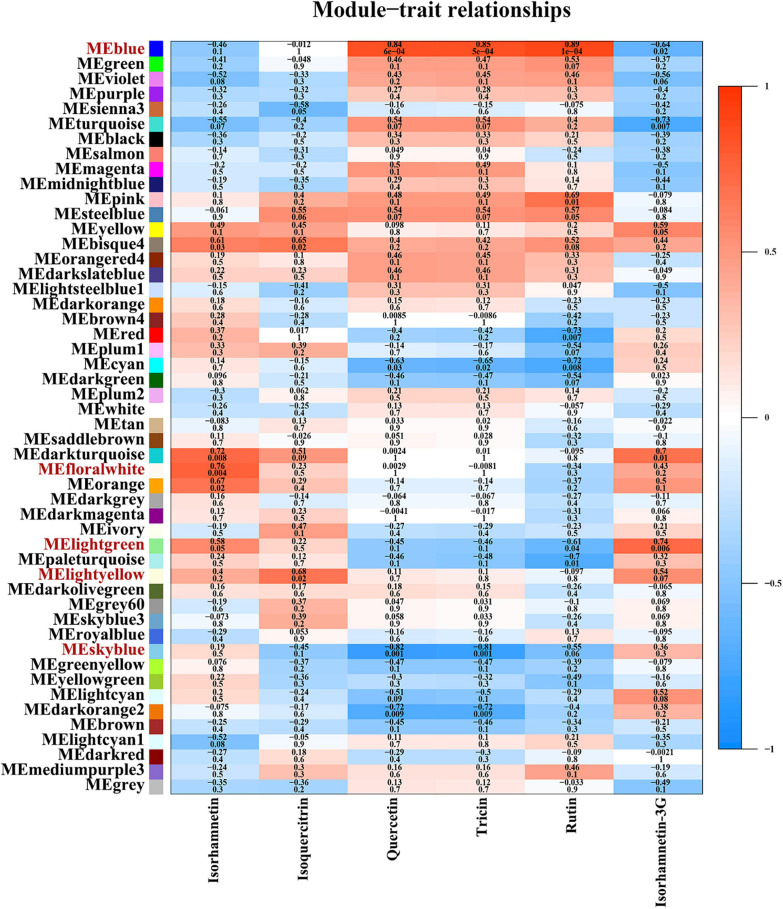
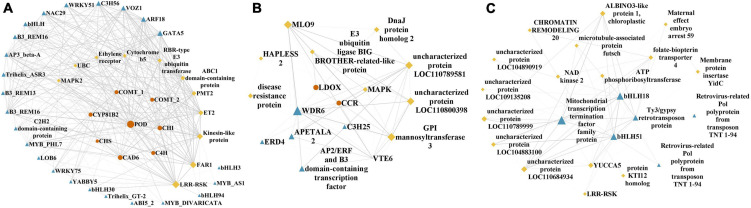
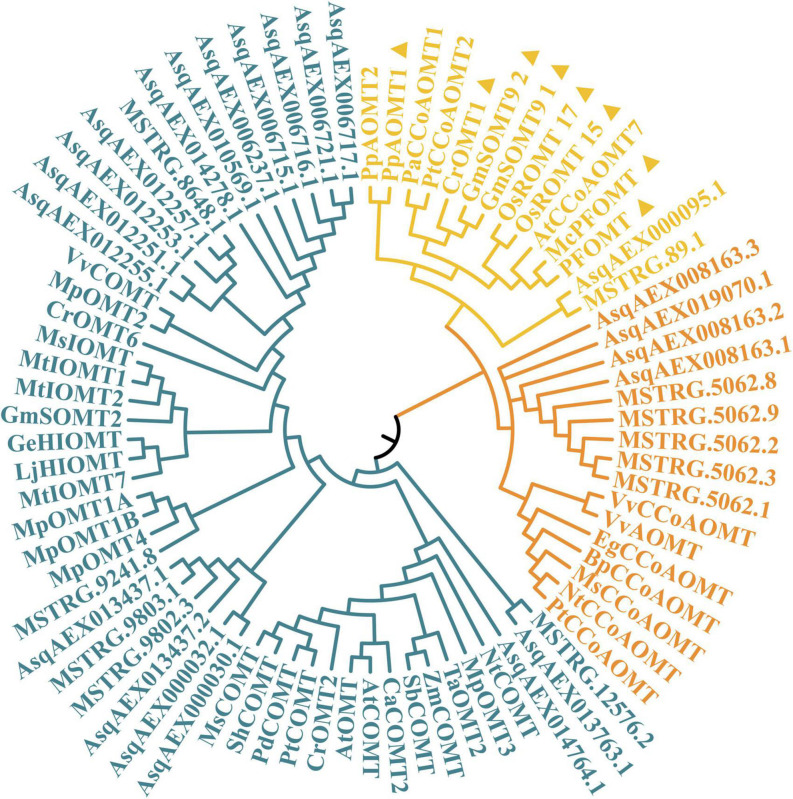
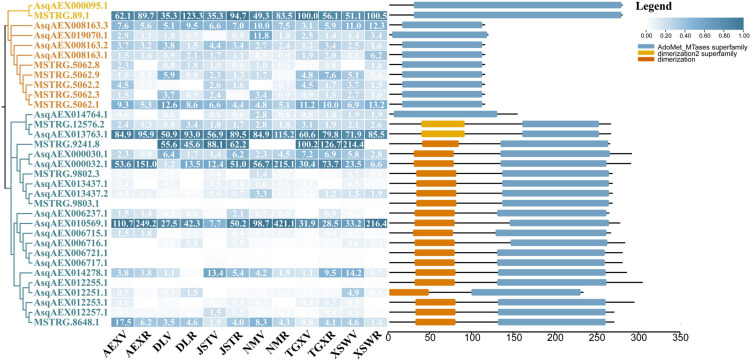
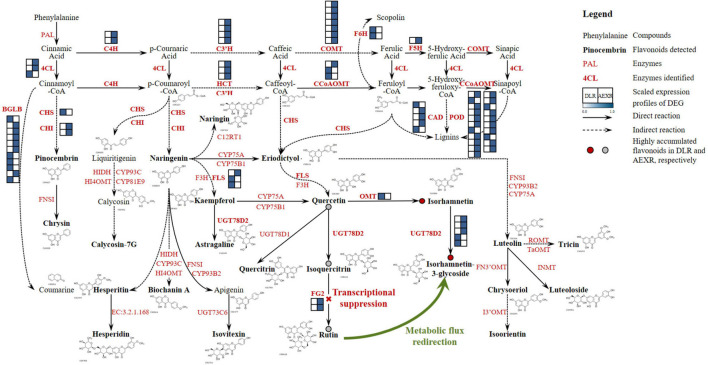
Agriophyllum squarrosum (L.) Moq., well known as sandrice, is an important wild forage in sandy areas and a promising edible and medicinal resource plant with great domestication potential. Previous studies showed flavonoids are one of the most abundant medicinal ingredients in sandrice, whereby isorhamnetin and isorhamnetin-3-glycoside were the top two flavonols with multiple health benefits. However, the molecular regulatory mechanisms of flavonoids in sandrice remain largely unclear. Based on a common garden trial, in this study, an integrated transcriptomic and flavonoids-targeted metabolomic analysis was performed on the vegetative and reproductive periods of six sandrice ecotypes, whose original habitats covered a variety of environmental factor gradients. Multiple linear stepwise regression analysis unveiled that flavonoid accumulation in sandrice was positively correlated with temperature and UVB and negatively affected by precipitation and sunshine duration, respectively. Weighted co-expression network analysis (WGCNA) indicated the bHLH and MYB transcription factor (TF) families might play key roles in sandrice flavonoid biosynthesis regulation. A total of 22,778 differentially expressed genes (DEGs) were identified between ecotype DL and ecotype AEX, the two extremes in most environmental factors, whereby 85 DEGs could be related to known flavonoid biosynthesis pathway. A sandrice flavonoid biosynthesis network embracing the detected 23 flavonoids in this research was constructed. Gene families Plant flavonoid O-methyltransferase (AsPFOMT) and UDP-glucuronosyltransferase (AsUGT78D2) were identified and characterized on the transcriptional level and believed to be synthases of isorhamnetin and isorhamnetin-3-glycoside in sandrice, respectively. A trade-off between biosynthesis of rutin and isorhamnetin was found in the DL ecotype, which might be due to the metabolic flux redirection when facing environmental changes. This research provides valuable information for understanding flavonoid biosynthesis in sandrice at the molecular level and laid the foundation for precise development and utilization of this functional resource forage.
Keywords: Agriophyllum squarrosum; common garden; flavonoids; isorhamnetin; isorhamnetin-3-glycoside; metabolome; sandrice; transcriptome.
Copyright © 2022 Fang, Zhou, Qian, Yan, Yin, Fan, Zhao, Liao, Shi, Chang and Ma.
Conflict of interest statement
Authors XY and X-FM were employed by the Marsgreen Biotech Jiangsu Co., Ltd. The remaining authors declare that the research was conducted in the absence of any commercial or financial relationships that could be construed as a potential conflict of interest.
Figures
Similar articles
-
A novel TF molecular switch-mechanism found in two contrasting ecotypes of a psammophyte, Agriophyllum squarrosum, in regulating transcriptional drought memory.BMC Plant Biol. 2023 Mar 30;23(1):167. doi: 10.1186/s12870-023-04154-6. BMC Plant Biol. 2023. PMID: 36997861 Free PMC article.
-
Flavonoid Synthesis Pathway Response to Low-Temperature Stress in a Desert Medicinal Plant, Agriophyllum Squarrosum (Sandrice).Genes (Basel). 2024 Sep 20;15(9):1228. doi: 10.3390/genes15091228. Genes (Basel). 2024. PMID: 39336819 Free PMC article.
-
Corrigendum: Integrated metabolomics and transcriptomics insights on flavonoid biosynthesis of a medicinal functional forage, Agriophyllum squarrosum (L.), based on a common garden trial covering six ecotypes.Front Plant Sci. 2022 Nov 23;13:1092707. doi: 10.3389/fpls.2022.1092707. eCollection 2022. Front Plant Sci. 2022. PMID: 36507418 Free PMC article.
-
Variations in Flavonoid Metabolites Along Altitudinal Gradient in a Desert Medicinal Plant Agriophyllum squarrosum.Front Plant Sci. 2021 Jun 30;12:683265. doi: 10.3389/fpls.2021.683265. eCollection 2021. Front Plant Sci. 2021. PMID: 34354722 Free PMC article.
-
Metabolomics and transcriptomics provide insights into the flavonoid biosynthesis pathway in the roots of developing Aster tataricus.J Plant Res. 2023 Jan;136(1):139-156. doi: 10.1007/s10265-022-01426-4. Epub 2022 Dec 15. J Plant Res. 2023. PMID: 36520245 Free PMC article.
Cited by
-
A novel TF molecular switch-mechanism found in two contrasting ecotypes of a psammophyte, Agriophyllum squarrosum, in regulating transcriptional drought memory.BMC Plant Biol. 2023 Mar 30;23(1):167. doi: 10.1186/s12870-023-04154-6. BMC Plant Biol. 2023. PMID: 36997861 Free PMC article.
-
Flavonoid Synthesis Pathway Response to Low-Temperature Stress in a Desert Medicinal Plant, Agriophyllum Squarrosum (Sandrice).Genes (Basel). 2024 Sep 20;15(9):1228. doi: 10.3390/genes15091228. Genes (Basel). 2024. PMID: 39336819 Free PMC article.
References
-
- Albert N. W., Thrimawithana A. H., McGhie T. K., Clayton W. A., Deroles S. C., Schwinn K. E., et al. (2018). Genetic analysis of the liverwort Marchantia polymorpha reveals that R2R3MYB activation of flavonoid production in response to abiotic stress is an ancient character in land plants. New Phytol. 218 554–566. 10.1111/nph.15002 - DOI - PubMed
-
- Casati P., Walbot V. (2005). Differential accumulation of maysin and rhamnosylisoorientin in leaves of high-altitude landraces of maize after UV-B exposure. Plant Cell Environ. 28 788–799. 10.1111/j.1365-3040.2005.01329.x - DOI
LinkOut - more resources
Full Text Sources
Miscellaneous